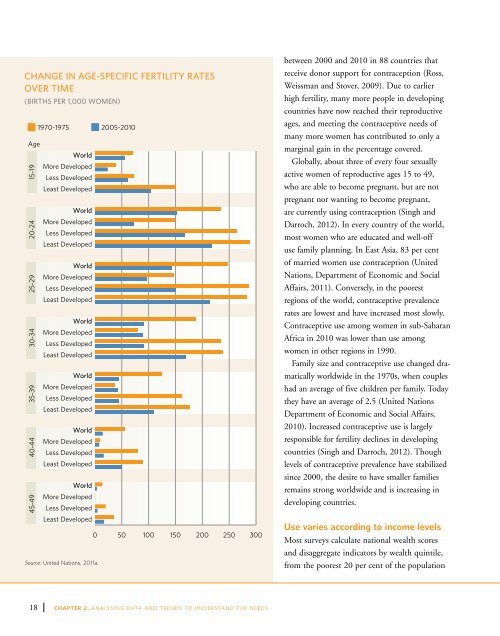
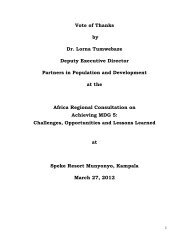
Change in Age-Specific Fertility RatesOver Time(Births per 1,000 Women)1970-1975 2005-2010Age<strong>World</strong>More DevelopedLess DevelopedLeast Developed45-49 40-4435-3930-3425-2920-2415-19<strong>World</strong>More DevelopedLess DevelopedLeast Developed<strong>World</strong>More DevelopedLess DevelopedLeast Developed<strong>World</strong>More DevelopedLess DevelopedLeast Developed<strong>World</strong>More DevelopedLess DevelopedLeast Developed<strong>World</strong>More DevelopedLess DevelopedLeast Developed<strong>World</strong>More DevelopedLess DevelopedLeast DevelopedSource: United Nations, 2011a.0 50 100 150 200 250 300between 2000 and 2010 in 88 countries thatreceive donor support for contraception (Ross,Weissman and Stover, 2009). Due to earlierhigh fertility, many more people in developingcountries have now reached their reproductiveages, and meeting the contraceptive needs <strong>of</strong>many more women has contributed to only amarginal gain in the percentage covered.Globally, about three <strong>of</strong> every four sexuallyactive women <strong>of</strong> reproductive ages 15 to 49,who are able to become pregnant, but are notpregnant nor wanting to become pregnant,are currently using contraception (Singh andDarroch, <strong>2012</strong>). In every country <strong>of</strong> the world,most women who are educated and well-<strong>of</strong>fuse family planning. In East Asia, 83 per cent<strong>of</strong> married women use contraception (UnitedNations, Department <strong>of</strong> Economic and SocialAffairs, 2011). Conversely, in the poorestregions <strong>of</strong> the world, contraceptive prevalencerates are lowest and have increased most slowly.Contraceptive use among women in sub-SaharanAfrica in 2010 was lower than use amongwomen in other regions in 1990.Family size and contraceptive use changed dramaticallyworldwide in the 1970s, when coupleshad an average <strong>of</strong> five children per family. Todaythey have an average <strong>of</strong> 2.5 (United NationsDepartment <strong>of</strong> Economic and Social Affairs,2010). Increased contraceptive use is largelyresponsible for fertility declines in developingcountries (Singh and Darroch, <strong>2012</strong>). Thoughlevels <strong>of</strong> contraceptive prevalence have stabilizedsince 2000, the desire to have smaller familiesremains strong worldwide and is increasing indeveloping countries.Use varies according to income levelsMost surveys calculate national wealth scoresand disaggregate indicators by wealth quintile,from the poorest 20 per cent <strong>of</strong> the population18 CHAPTER 2: ANALYSING DATA AND TRENDS TO UNDERSTAND THE needs
through the wealthiest 20 per cent. Quintileanalyses <strong>of</strong> population-based surveys can helpidentify inequalities and family planning needswithin countries, especially in combination withdata on urban-rural and other important dimensions<strong>of</strong> access (Health Policy Initiative, TaskOrder 1, 2010).Because poverty takes on specific characteristicswithin a given setting, some researchersnow advocate for separate quintile rankings forurban and rural populations to paint a morecomplete picture <strong>of</strong> inequalities between povertyand wealth in both urban and rural areas.This approach makes it possible to compare thedifferent experiences <strong>of</strong> poor women in urbansettings and relatively wealthy women in ruralcommunities. Research from a 16-country studyacross Africa, Asia, and Latin America and theCaribbean finds strong relationships betweenfamily planning use, socioeconomic status,and place <strong>of</strong> residence (Foreit, Karra andPandit-Rajani, 2010).In countries such as Bangladesh, the prevalence<strong>of</strong> modern contraceptive use is the sameacross wealth quintiles in urban and rural settings:there is a nominal difference betweencontraceptive use among rich and poor in urbancommunities, and between the wealthiest andpoorest within rural settings (Demographicand Health Surveys, 2007). In Bangladesh, theprevalence <strong>of</strong> contraceptive use is greater (by 6per cent) in urban areas. Similar findings, whichsupport pro-rural strategies, have been found inPeru, which would warrant pro-rural programming,as would Bolivia, Ethiopia, Madagascar,Tanzania and Zambia (Health Policy Initiative,Task Order 1, 2010). In some countries, such asNigeria (DHS, 2008), modern contraceptive useincreases with increasing wealth for people wholive in urban and rural areas. The key differenceis the rate <strong>of</strong> change: wealthier people in ruralsettings report higher use <strong>of</strong> contraceptives thanthe urban poor. These results would supportpolicies that focus on reaching the urban poor,especially if similar patterns <strong>of</strong> disparities existamong indicators that measure adverse sexualand reproductive health outcomes.Educational achievement influencesdesired family size, family planning useand fertilityLevel <strong>of</strong> schooling is associated with desiredfamily size, contraceptive use and fertility. Ananalysis <strong>of</strong> 24 sub-Saharan African countriesshowed that the adolescents most likely tobecome mothers are poor, uneducated and livein rural areas (Lloyd, 2009). Birth rates aremore than four times as high among uneducatedadolescent girls ages 15 to 19 as amonggirls who have at least secondary schooling. Asimilar gap exists based on wealth and residence.And in these countries, the gaps are widening:births among adolescent girls between the ages<strong>of</strong> 15 and 19 with no education have increasedtHigh school studentsin Bucharest, Romania,read a leaflet aboutcondoms.©Panos/Peter BarkerTHE STATE OF WORLD POPULATION <strong>2012</strong>19
- Page 6 and 7: OverviewOne hundred seventy-nine go
- Page 8 and 9: The report is structured to answer
- Page 10 and 11: viiiCHAPTER 1: THE RIGHT TO FAMILY
- Page 12 and 13: “All human beings are born free a
- Page 14 and 15: Treaties, conventions and agreement
- Page 16 and 17: Health: a social and economic right
- Page 18: “Everyone has the right to educat
- Page 21 and 22: designing and delivering accessible
- Page 23 and 24: use, and reduces unintended pregnan
- Page 26 and 27: 16 CHAPTER 2: ANALYSING DATA AND TR
- Page 30 and 31: Sexuality, sexual and gender stereo
- Page 32 and 33: not necessarily associated with a d
- Page 34 and 35: METHOD EFFECTIVENESSMethod, rankedf
- Page 36 and 37: tCouple visiting a ruralfamily plan
- Page 38: Demand and supply over time5 per ce
- Page 41 and 42: contribute to high unmet need (Sing
- Page 43 and 44: abortions in the region lead to mor
- Page 45 and 46: (as stated in the Convention on the
- Page 47 and 48: arriers prevent individuals from ac
- Page 49 and 50: CHAPTERTHREEChallenges in extending
- Page 51 and 52: sources of sexual and reproductive
- Page 53 and 54: messages were delivered via a numbe
- Page 55 and 56: Ricardo, 2005). Moreover, young and
- Page 58 and 59: per cent in Guatemala. Across all c
- Page 60 and 61: tTeenager inMadagascar listens toa
- Page 62 and 63: Consensual unions account for an in
- Page 64 and 65: when. The proportion of never-marri
- Page 66 and 67: 63 per cent to 93 per cent of young
- Page 68 and 69: Family planning in humanitariansett
- Page 71 and 72: Studies suggest that HIV may have a
- Page 73 and 74: with a public health challenge (Wor
- Page 75 and 76: State-run family planning programme
- Page 77 and 78: people in mobile, temporary, and re
- Page 79 and 80:
systems and civic participation to
- Page 81 and 82:
CHAPTERFOURThe social and economici
- Page 83 and 84:
tCommunityeducation inCaracas, Vene
- Page 85 and 86:
Estimates of Total Fertility2010-20
- Page 87 and 88:
children, and healthier women also
- Page 89 and 90:
empirical evidence supporting this
- Page 92 and 93:
tRicardo and Sarain Mexico City say
- Page 94 and 95:
to secure the future population’s
- Page 96 and 97:
86 CHAPTER 5: THE COSTS AND SAVINGS
- Page 98 and 99:
Unintended Pregnancies and outcomes
- Page 100 and 101:
tDonor Commitmentspanel at the Lond
- Page 102 and 103:
UNFPA supports the Health for All c
- Page 104 and 105:
tDr. BabatundeOsotimehin, Executive
- Page 106 and 107:
96 CHAPTER 6: MAKING THE RIGHT TO F
- Page 108 and 109:
When individuals are able to exerci
- Page 110 and 111:
Family planning programmes must ref
- Page 112 and 113:
Family planning programmes reinforc
- Page 114:
tPresident of NigeriaGoodluck Jonat
- Page 117 and 118:
Monitoring Monitoring ICPD ICPD Goa
- Page 119 and 120:
Monitoring Monitoring ICPD ICPD Goa
- Page 121 and 122:
Monitoring Monitoring ICPD ICPD Goa
- Page 123 and 124:
Monitoring ICPD Goals Demographic -
- Page 125 and 126:
Monitoring ICPD Goals - Selected In
- Page 127 and 128:
BibliographyAbbasi-Shavazi, Mohamma
- Page 129 and 130:
Monitoring ICPD Goals - Selected In
- Page 131 and 132:
Monitoring ICPD Goals - Selected In
- Page 133 and 134:
Monitoring ICPD Goals - Selected In
- Page 135 and 136:
Monitoring ICPD Goals - Selected In
- Page 137 and 138:
Monitoring ICPD Goals - Selected In
- Page 140:
Delivering a world where every preg