- Page 2 and 3:
contentsKey Figures 2-3Chairman’s
- Page 5 and 6:
2key Figures3Net banking incomeby c
- Page 7 and 8:
4chairman‘s and chief executive o
- Page 9 and 10:
6executive committee7COMMITTEEBNP P
- Page 11 and 12:
8trademark portfolio9BNP Paribas op
- Page 13 and 14:
The bankfor a connected10the bank f
- Page 15 and 16:
12the bank for a connected world13C
- Page 17 and 18:
14the group‘s core businesses15Fi
- Page 19 and 20:
the Netherlands. UCB has also devel
- Page 21 and 22:
ices• The division’s savings bu
- Page 23 and 24:
14chiffres clés15GASSixty Partners
- Page 25 and 26:
18CORPORATE AND INVESTMENT BANKING1
- Page 27 and 28:
20CORPORATE AND INVESTMENT BANKING2
- Page 29 and 30:
Equities andDerivatives22CORPORATE
- Page 31 and 32:
24CORPORATE AND INVESTMENT BANKING2
- Page 33 and 34:
Bnp paribas london26CORPORATE AND I
- Page 35:
28CORPORATE AND INVESTMENT BANKING2
- Page 38 and 39:
etailbankingFrench RetailBankingInt
- Page 40 and 41:
RATPChangeover Points, Hubs of Mixe
- Page 42 and 43:
IndividualclientsA fully operationa
- Page 44 and 45:
Personal loan businessoutpaces mark
- Page 46 and 47: entrepreneursand freelanceprofessio
- Page 48 and 49: The acquisition of Teisseire by Fru
- Page 50 and 51: BIOVALEurope’s Largest Biotechnol
- Page 52 and 53: internationalretail banking andf in
- Page 54 and 55: • Outside France, new lending fur
- Page 56 and 57: np paribaslease groupFollowing two
- Page 58 and 59: ancwestThe sharp upturn in the Amer
- Page 60 and 61: teb istanbulEmerging andOverseas Ma
- Page 63 and 64: 56retail banking57MANOBIExchanges o
- Page 65 and 66: 58asset management and services59
- Page 67 and 68: 6061asset management and servicesAM
- Page 69 and 70: 6263asset management and servicesco
- Page 71 and 72: asset management et servicesPaving
- Page 73 and 74: 66asset management and services67Bn
- Page 75 and 76: 68asset management and services69bn
- Page 77 and 78: 70asset management and services71Ta
- Page 79: 72asset management and services73BN
- Page 82 and 83: klépierre
- Page 84 and 85: np paribascapital
- Page 87 and 88: Patrick GeeraertHead of the Finance
- Page 89 and 90: 82sustainable development83THE GROU
- Page 91 and 92: 84sustainable development85• SAMS
- Page 93 and 94: 86sustainable development87As a res
- Page 95: 88sustainable development89BNP Pari
- Page 99 and 100: 92sustainable development93Communic
- Page 101 and 102: 94sustainable development95Liaison
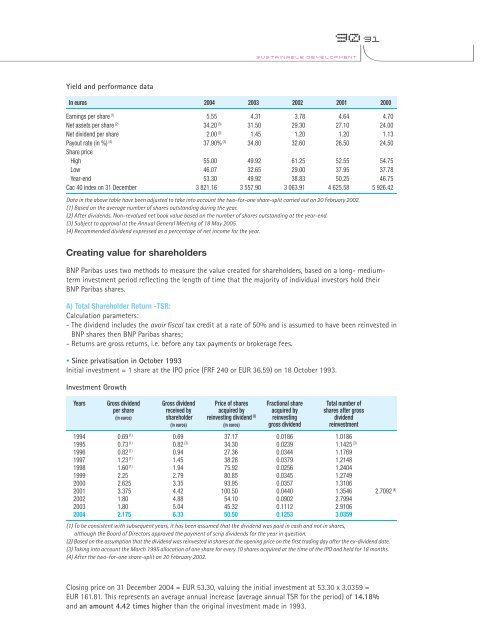
- Page 103 and 104: 96sustainable development97Dividend
- Page 105 and 106: 98sustainable development99Disclosu
- Page 107 and 108: HUMAN RESOURCESDEVELOPMENT100sustai
- Page 109 and 110: 102sustainable development103(in %)
- Page 111 and 112: 104sustainable development105- the
- Page 113 and 114: 106sustainable development107Employ
- Page 115 and 116: 108sustainable development109Lastly
- Page 117 and 118: 110sustainable development111relati
- Page 119 and 120: 112sustainable development113Qualit
- Page 121 and 122: 114sustainable development115BNP Pa
- Page 123 and 124: 116sustainable development117Vendor
- Page 125 and 126: 118118119119sustainable development
- Page 127 and 128: 120sustainable development121Partne
- Page 129 and 130: 122développement durable123Chetan
- Page 131 and 132: 124sustainable development125This p
- Page 133 and 134: 126sustainable development12750 art
- Page 135 and 136: 128sustainable development129BNP Pa
- Page 137 and 138: 10101001010010100100101010101000011
- Page 139 and 140: 132board of directors133Jacques Fri
- Page 141 and 142: 134EXTRACTS FROM THE BOARD OF DIREC
- Page 143 and 144: 136report of the chairman137• The
- Page 145 and 146: 138report of the chairman139de l’
- Page 147 and 148:
140report of the chairman141• the
- Page 149 and 150:
142report of the chairman143As part
- Page 151 and 152:
144report of the chairman145for con
- Page 153 and 154:
146report of the chairman147to comb
- Page 155 and 156:
148report of the chairman149Human r
- Page 157 and 158:
150remuneration151remunerationRemun
- Page 159 and 160:
152remuneration153Remuneration of o
- Page 161:
154remuneration155Information on st
- Page 164 and 165:
Financialand legalinformation
- Page 166 and 167:
ACTIVITY2004 REVIEW OF OPERATIONSCO
- Page 168 and 169:
RESULTS OF EACH CORE BUSINESS1 - RE
- Page 170 and 171:
The Retail Banking business in Emer
- Page 172 and 173:
The core business’ operating expe
- Page 174 and 175:
Interbank and money-market items. I
- Page 176 and 177:
RECENT DEVELOPMENTS11 February 2005
- Page 178 and 179:
CHANGES IN SHARE CAPITALNumber of s
- Page 180 and 181:
REGULATORY RATIOSInternational capi
- Page 182 and 183:
on retirement bonuses should be acc
- Page 184 and 185:
Realised gains and losses on availa
- Page 186 and 187:
Credit and Counterparty Risks, comp
- Page 188 and 189:
ates (market rates and signature sp
- Page 190 and 191:
Group Tax Affairs resources include
- Page 192 and 193:
fundamentally sound companies that
- Page 194 and 195:
• GEaRThe Bank measures Value at
- Page 196 and 197:
asis for hedging decisions taking i
- Page 198 and 199:
BNP PARIBAS - ANNUAL REPORT 2004192
- Page 200 and 201:
CONSOLIDATED BALANCE SHEETASSETSIn
- Page 202 and 203:
CONSOLIDATED PROFIT AND LOSS ACCOUN
- Page 204 and 205:
APPENDICESNOTE 1ACCOUNTING POLICIES
- Page 206 and 207:
association, provided that the Grou
- Page 208 and 209:
However, when the market value of l
- Page 210 and 211:
fixed income instruments (whether f
- Page 212 and 213:
In order to reflect what appeared t
- Page 214 and 215:
countries in which they operate. In
- Page 216 and 217:
NOTE 2 - SCOPE OF CONSOLIDATIONChan
- Page 218 and 219:
Fully-consolidated companiesFinanci
- Page 220 and 221:
Financial institutions Group voting
- Page 222 and 223:
Financial institutions Group voting
- Page 224 and 225:
Other companies Group voting Group
- Page 226 and 227:
Other companies Group voting Group
- Page 228 and 229:
NOTE 3INTERBANK AND MONEY-MARKET IT
- Page 230 and 231:
NOTE 5TRANSACTIONS ON TRADING ACCOU
- Page 232 and 233:
NOTE 6INSURANCE COMPANY INVESTMENTS
- Page 234 and 235:
NOTE 7 (CONT’D)INVESTMENTS IN NON
- Page 236 and 237:
NOTE 8 (CONT’D)PROVISIONS FOR CRE
- Page 238 and 239:
NOTE 10LONG-TERM INVESTMENTSIn mill
- Page 240 and 241:
NOTE 12GOODWILLIn millions of euros
- Page 242 and 243:
NOTE 15CUSTOMER DEPOSITS, RETAIL CE
- Page 244 and 245:
NOTE 17TECHNICAL RESERVES OF INSURA
- Page 246 and 247:
NOTE 20SUBORDINATED DEBTIn millions
- Page 248 and 249:
NOTE 22CONSOLIDATED SHAREHOLDERS’
- Page 250 and 251:
NOTE 22 (CONT’D)CONSOLIDATED SHAR
- Page 252 and 253:
NOTE 22 (CONT’D)CONSOLIDATED SHAR
- Page 254 and 255:
NOTE 24FORWARD AND OPTIONS CONTRACT
- Page 256 and 257:
NOTE 25BNP PARIBAS GROUP EXPOSURE T
- Page 258 and 259:
NOTE 26 (CONT’D)SECURITISATIONS
- Page 260 and 261:
NOTE 28MATURITY SCHEDULE OF LOANS,
- Page 262 and 263:
NOTE 31NET INTEREST INCOME (EXPENSE
- Page 264 and 265:
NOTE 34UNDERWRITING RESULT AND NET
- Page 266 and 267:
NOTE 36STOCK OPTION PLANS1 - BNP PA
- Page 268 and 269:
NOTE 37GAINS (LOSSES) ON DISPOSALS
- Page 270 and 271:
NOTE 39SEGMENT INFORMATION• Incom
- Page 272 and 273:
NOTE 41BNP-PARIBAS MERGER-RELATED R
- Page 274 and 275:
• BNP Paribas records provisions
- Page 276 and 277:
PARENT COMPANY FINANCIAL STATEMENTS
- Page 278 and 279:
PROFIT AND LOSS ACCOUNT OF BNP PARI
- Page 280 and 281:
debt securities. They also include
- Page 282 and 283:
• Debt Securities Held to Maturit
- Page 284 and 285:
Forward financial instruments are p
- Page 286 and 287:
Recognition of Revenue and Expenses
- Page 288 and 289:
SUBSIDIARIES AND AFFILIATESSubsidia
- Page 290 and 291:
Subsidiaries and affiliates Currenc
- Page 292 and 293:
ACQUISITIONSOF EQUITY INTERESTS BY
- Page 294 and 295:
SOCIAL AND ENVIRONMENTALINDICATORS
- Page 296 and 297:
NRE indicator 2004 Comments Scope c
- Page 298 and 299:
NRE indicator 2004 Comments Scope c
- Page 300 and 301:
NRE indicator 2004 Comments Scope c
- Page 302 and 303:
NRE indicator 2004 Comments Scope c
- Page 304 and 305:
NRE indicator 2004 Comments Scope c
- Page 306 and 307:
GENERAL INFORMATIONLEGAL INFORMATIO
- Page 308 and 309:
The Axa group has also given a comm
- Page 310 and 311:
STATUTORY AUDITORSNames and address
- Page 312 and 313:
COMBINED ANNUAL AND EXTRAORDINARYGE
- Page 314 and 315:
• Eighth resolution (Renewal of t
- Page 316 and 317:
• Seventeenth resolution (Amendme
- Page 318 and 319:
Capital increaseCash flowCECEICIBA
- Page 320 and 321:
Investment clubIRBIRFSISIN codeLBOL
- Page 322 and 323:
Prime brokeragePublic tender offerQ
- Page 324 and 325:
NOTES. . . . . . . . . . . . . . .
- Page 326:
www.bnpparibas.comHEAD OFFICE16, bo