Deliverable 4.4 - INSEAD CALT
Deliverable 4.4 - INSEAD CALT
Deliverable 4.4 - INSEAD CALT

You also want an ePaper? Increase the reach of your titles
YUMPU automatically turns print PDFs into web optimized ePapers that Google loves.
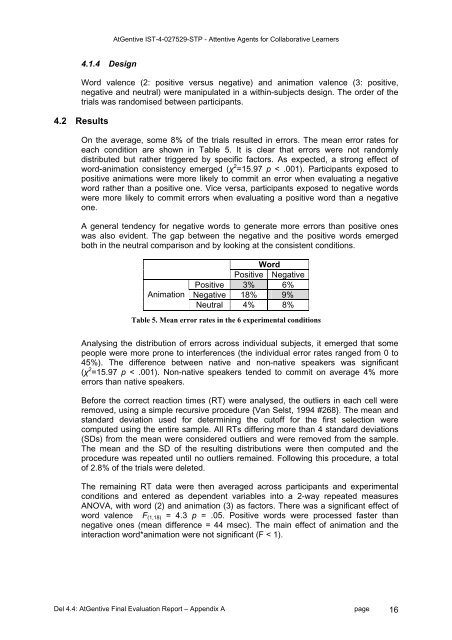
AtGentive IST-4-027529-STP - Attentive Agents for Collaborative Learners4.1.4 DesignWord valence (2: positive versus negative) and animation valence (3: positive,negative and neutral) were manipulated in a within-subjects design. The order of thetrials was randomised between participants.4.2 ResultsOn the average, some 8% of the trials resulted in errors. The mean error rates foreach condition are shown in Table 5. It is clear that errors were not randomlydistributed but rather triggered by specific factors. As expected, a strong effect ofword-animation consistency emerged (χ 2 =15.97 p < .001). Participants exposed topositive animations were more likely to commit an error when evaluating a negativeword rather than a positive one. Vice versa, participants exposed to negative wordswere more likely to commit errors when evaluating a positive word than a negativeone.A general tendency for negative words to generate more errors than positive oneswas also evident. The gap between the negative and the positive words emergedboth in the neutral comparison and by looking at the consistent conditions.AnimationWordPositive NegativePositive 3% 6%Negative 18% 9%Neutral 4% 8%Table 5. Mean error rates in the 6 experimental conditionsAnalysing the distribution of errors across individual subjects, it emerged that somepeople were more prone to interferences (the individual error rates ranged from 0 to45%). The difference between native and non-native speakers was significant(χ 2 =15.97 p < .001). Non-native speakers tended to commit on average 4% moreerrors than native speakers.Before the correct reaction times (RT) were analysed, the outliers in each cell wereremoved, using a simple recursive procedure {Van Selst, 1994 #268}. The mean andstandard deviation used for determining the cutoff for the first selection werecomputed using the entire sample. All RTs differing more than 4 standard deviations(SDs) from the mean were considered outliers and were removed from the sample.The mean and the SD of the resulting distributions were then computed and theprocedure was repeated until no outliers remained. Following this procedure, a totalof 2.8% of the trials were deleted.The remaining RT data were then averaged across participants and experimentalconditions and entered as dependent variables into a 2-way repeated measuresANOVA, with word (2) and animation (3) as factors. There was a significant effect ofword valence F (1,18) = 4.3 p = .05. Positive words were processed faster thannegative ones (mean difference = 44 msec). The main effect of animation and theinteraction word*animation were not significant (F < 1).Del <strong>4.4</strong>: AtGentive Final Evaluation Report – Appendix A page 16