Deliverable 4.4 - INSEAD CALT
Deliverable 4.4 - INSEAD CALT
Deliverable 4.4 - INSEAD CALT
Create successful ePaper yourself
Turn your PDF publications into a flip-book with our unique Google optimized e-Paper software.
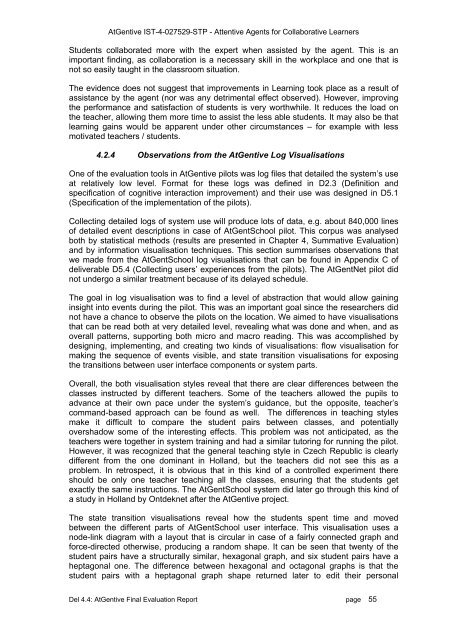
AtGentive IST-4-027529-STP - Attentive Agents for Collaborative LearnersStudents collaborated more with the expert when assisted by the agent. This is animportant finding, as collaboration is a necessary skill in the workplace and one that isnot so easily taught in the classroom situation.The evidence does not suggest that improvements in Learning took place as a result ofassistance by the agent (nor was any detrimental effect observed). However, improvingthe performance and satisfaction of students is very worthwhile. It reduces the load onthe teacher, allowing them more time to assist the less able students. It may also be thatlearning gains would be apparent under other circumstances – for example with lessmotivated teachers / students.4.2.4 Observations from the AtGentive Log VisualisationsOne of the evaluation tools in AtGentive pilots was log files that detailed the system’s useat relatively low level. Format for these logs was defined in D2.3 (Definition andspecification of cognitive interaction improvement) and their use was designed in D5.1(Specification of the implementation of the pilots).Collecting detailed logs of system use will produce lots of data, e.g. about 840,000 linesof detailed event descriptions in case of AtGentSchool pilot. This corpus was analysedboth by statistical methods (results are presented in Chapter 4, Summative Evaluation)and by information visualisation techniques. This section summarises observations thatwe made from the AtGentSchool log visualisations that can be found in Appendix C ofdeliverable D5.4 (Collecting users’ experiences from the pilots). The AtGentNet pilot didnot undergo a similar treatment because of its delayed schedule.The goal in log visualisation was to find a level of abstraction that would allow gaininginsight into events during the pilot. This was an important goal since the researchers didnot have a chance to observe the pilots on the location. We aimed to have visualisationsthat can be read both at very detailed level, revealing what was done and when, and asoverall patterns, supporting both micro and macro reading. This was accomplished bydesigning, implementing, and creating two kinds of visualisations: flow visualisation formaking the sequence of events visible, and state transition visualisations for exposingthe transitions between user interface components or system parts.Overall, the both visualisation styles reveal that there are clear differences between theclasses instructed by different teachers. Some of the teachers allowed the pupils toadvance at their own pace under the system’s guidance, but the opposite, teacher’scommand-based approach can be found as well. The differences in teaching stylesmake it difficult to compare the student pairs between classes, and potentiallyovershadow some of the interesting effects. This problem was not anticipated, as theteachers were together in system training and had a similar tutoring for running the pilot.However, it was recognized that the general teaching style in Czech Republic is clearlydifferent from the one dominant in Holland, but the teachers did not see this as aproblem. In retrospect, it is obvious that in this kind of a controlled experiment thereshould be only one teacher teaching all the classes, ensuring that the students getexactly the same instructions. The AtGentSchool system did later go through this kind ofa study in Holland by Ontdeknet after the AtGentive project.The state transition visualisations reveal how the students spent time and movedbetween the different parts of AtGentSchool user interface. This visualisation uses anode-link diagram with a layout that is circular in case of a fairly connected graph andforce-directed otherwise, producing a random shape. It can be seen that twenty of thestudent pairs have a structurally similar, hexagonal graph, and six student pairs have aheptagonal one. The difference between hexagonal and octagonal graphs is that thestudent pairs with a heptagonal graph shape returned later to edit their personalDel <strong>4.4</strong>: AtGentive Final Evaluation Report page 55


