Deliverable 4.4 - INSEAD CALT
Deliverable 4.4 - INSEAD CALT
Deliverable 4.4 - INSEAD CALT

You also want an ePaper? Increase the reach of your titles
YUMPU automatically turns print PDFs into web optimized ePapers that Google loves.
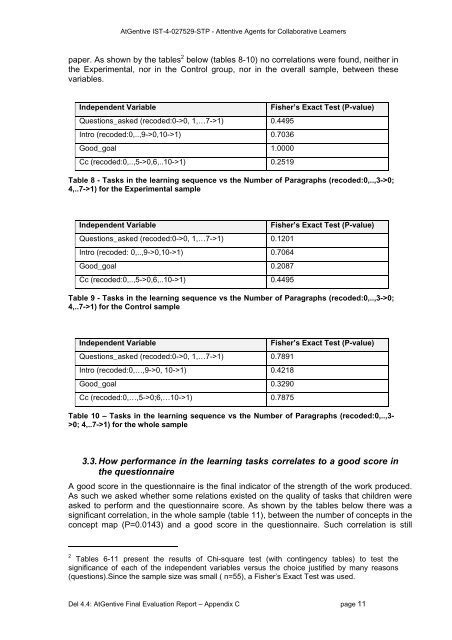
AtGentive IST-4-027529-STP - Attentive Agents for Collaborative Learnerspaper. As shown by the tables 2 below (tables 8-10) no correlations were found, neither inthe Experimental, nor in the Control group, nor in the overall sample, between thesevariables.Independent VariableQuestions_asked (recoded:0->0, 1,…7->1) 0.4495Intro (recoded:0,..,9->0,10->1) 0.7036Good_goal 1.0000Cc (recoded:0,..,5->0,6,..10->1) 0.2519Fisher’s Exact Test (P-value)Table 8 - Tasks in the learning sequence vs the Number of Paragraphs (recoded:0,..,3->0;4,..7->1) for the Experimental sampleIndependent VariableFisher’s Exact Test (P-value)Questions_asked (recoded:0->0, 1,…7->1) 0.1201Intro (recoded: 0,..,9->0,10->1) 0.7064Good_goal 0.2087Cc (recoded:0,..,5->0,6,..10->1) 0.4495Table 9 - Tasks in the learning sequence vs the Number of Paragraphs (recoded:0,..,3->0;4,..7->1) for the Control sampleIndependent VariableFisher’s Exact Test (P-value)Questions_asked (recoded:0->0, 1,…7->1) 0.7891Intro (recoded:0,…,9->0, 10->1) 0.4218Good_goal 0.3290Cc (recoded:0,…,5->0;6,…10->1) 0.7875Table 10 – Tasks in the learning sequence vs the Number of Paragraphs (recoded:0,..,3->0; 4,..7->1) for the whole sample3.3. How performance in the learning tasks correlates to a good score inthe questionnaireA good score in the questionnaire is the final indicator of the strength of the work produced.As such we asked whether some relations existed on the quality of tasks that children wereasked to perform and the questionnaire score. As shown by the tables below there was asignificant correlation, in the whole sample (table 11), between the number of concepts in theconcept map (P=0.0143) and a good score in the questionnaire. Such correlation is still2 Tables 6-11 present the results of Chi-square test (with contingency tables) to test thesignificance of each of the independent variables versus the choice justified by many reasons(questions).Since the sample size was small ( n=55), a Fisher’s Exact Test was used.Del <strong>4.4</strong>: AtGentive Final Evaluation Report – Appendix C page 11