Deliverable 4.4 - INSEAD CALT
Deliverable 4.4 - INSEAD CALT
Deliverable 4.4 - INSEAD CALT

You also want an ePaper? Increase the reach of your titles
YUMPU automatically turns print PDFs into web optimized ePapers that Google loves.
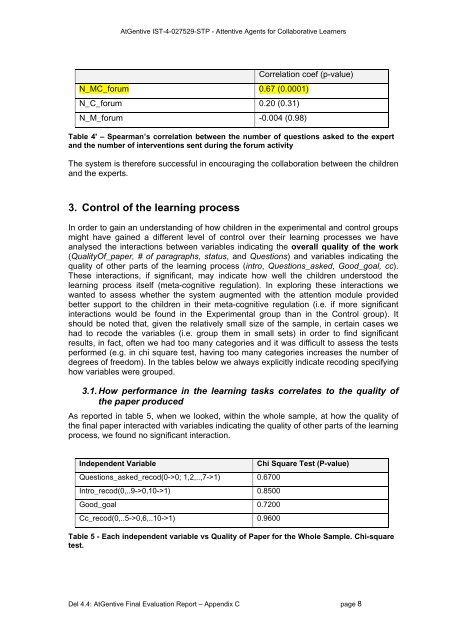
AtGentive IST-4-027529-STP - Attentive Agents for Collaborative LearnersCorrelation coef (p-value)N_MC_forum 0.67 (0.0001)N_C_forum 0.20 (0.31)N_M_forum -0.004 (0.98)Table 4' – Spearman’s correlation between the number of questions asked to the expertand the number of interventions sent during the forum activityThe system is therefore successful in encouraging the collaboration between the childrenand the experts.3. Control of the learning processIn order to gain an understanding of how children in the experimental and control groupsmight have gained a different level of control over their learning processes we haveanalysed the interactions between variables indicating the overall quality of the work(QualityOf_paper, # of paragraphs, status, and Questions) and variables indicating thequality of other parts of the learning process (intro, Questions_asked, Good_goal, cc).These interactions, if significant, may indicate how well the children understood thelearning process itself (meta-cognitive regulation). In exploring these interactions wewanted to assess whether the system augmented with the attention module providedbetter support to the children in their meta-cognitive regulation (i.e. if more significantinteractions would be found in the Experimental group than in the Control group). Itshould be noted that, given the relatively small size of the sample, in certain cases wehad to recode the variables (i.e. group them in small sets) in order to find significantresults, in fact, often we had too many categories and it was difficult to assess the testsperformed (e.g. in chi square test, having too many categories increases the number ofdegrees of freedom). In the tables below we always explicitly indicate recoding specifyinghow variables were grouped.3.1. How performance in the learning tasks correlates to the quality ofthe paper producedAs reported in table 5, when we looked, within the whole sample, at how the quality ofthe final paper interacted with variables indicating the quality of other parts of the learningprocess, we found no significant interaction.Independent VariableQuestions_asked_recod(0->0; 1,2,..,7->1) 0.6700Intro_recod(0,..9->0,10->1) 0.8500Good_goal 0.7200Cc_recod(0,..5->0,6,..10->1) 0.9600Chi Square Test (P-value)Table 5 - Each independent variable vs Quality of Paper for the Whole Sample. Chi-squaretest.Del <strong>4.4</strong>: AtGentive Final Evaluation Report – Appendix C page 8