developing a model for integrating safety, quality and productivity in ...
developing a model for integrating safety, quality and productivity in ...
developing a model for integrating safety, quality and productivity in ...

You also want an ePaper? Increase the reach of your titles
YUMPU automatically turns print PDFs into web optimized ePapers that Google loves.
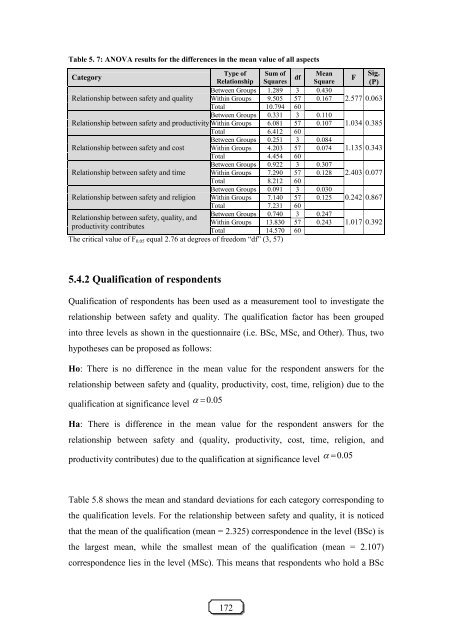
Table 5. 7: ANOVA results <strong>for</strong> the differences <strong>in</strong> the mean value of all aspectsType of Sum of MeanCategorydfRelationship Squares SquareBetween Groups 1.289 3 0.430Relationship between <strong>safety</strong> <strong>and</strong> <strong>quality</strong> With<strong>in</strong> Groups 9.505 57 0.167Total 10.794 60Between Groups 0.331 3 0.110Relationship between <strong>safety</strong> <strong>and</strong> <strong>productivity</strong> With<strong>in</strong> Groups 6.081 57 0.107Total 6.412 60Between Groups 0.251 3 0.084Relationship between <strong>safety</strong> <strong>and</strong> cost With<strong>in</strong> Groups 4.203 57 0.074Total 4.454 60Between Groups 0.922 3 0.307Relationship between <strong>safety</strong> <strong>and</strong> time With<strong>in</strong> Groups 7.290 57 0.128Total 8.212 60Between Groups 0.091 3 0.030Relationship between <strong>safety</strong> <strong>and</strong> religion With<strong>in</strong> Groups 7.140 57 0.125Total 7.231 60Between Groups 0.740 3 0.247Relationship between <strong>safety</strong>, <strong>quality</strong>, <strong>and</strong>With<strong>in</strong> Groups 13.830 57 0.243<strong>productivity</strong> contributesTotal 14.570 60The critical value of F 0.05 equal 2.76 at degrees of freedom “df” (3, 57)FSig.(P)2.577 0.0631.034 0.3851.135 0.3432.403 0.0770.242 0.8671.017 0.3925.4.2 Qualification of respondentsQualification of respondents has been used as a measurement tool to <strong>in</strong>vestigate therelationship between <strong>safety</strong> <strong>and</strong> <strong>quality</strong>. The qualification factor has been grouped<strong>in</strong>to three levels as shown <strong>in</strong> the questionnaire (i.e. BSc, MSc, <strong>and</strong> Other). Thus, twohypotheses can be proposed as follows:Ho: There is no difference <strong>in</strong> the mean value <strong>for</strong> the respondent answers <strong>for</strong> therelationship between <strong>safety</strong> <strong>and</strong> (<strong>quality</strong>, <strong>productivity</strong>, cost, time, religion) due to thequalification at significance levelα =0.05Ha: There is difference <strong>in</strong> the mean value <strong>for</strong> the respondent answers <strong>for</strong> therelationship between <strong>safety</strong> <strong>and</strong> (<strong>quality</strong>, <strong>productivity</strong>, cost, time, religion, <strong>and</strong><strong>productivity</strong> contributes) due to the qualification at significance levelα =0.05Table 5.8 shows the mean <strong>and</strong> st<strong>and</strong>ard deviations <strong>for</strong> each category correspond<strong>in</strong>g tothe qualification levels. For the relationship between <strong>safety</strong> <strong>and</strong> <strong>quality</strong>, it is noticedthat the mean of the qualification (mean = 2.325) correspondence <strong>in</strong> the level (BSc) isthe largest mean, while the smallest mean of the qualification (mean = 2.107)correspondence lies <strong>in</strong> the level (MSc). This means that respondents who hold a BSc172