Annual Report and Accounts 2006 - DCC plc
Annual Report and Accounts 2006 - DCC plc
Annual Report and Accounts 2006 - DCC plc

Create successful ePaper yourself
Turn your PDF publications into a flip-book with our unique Google optimized e-Paper software.
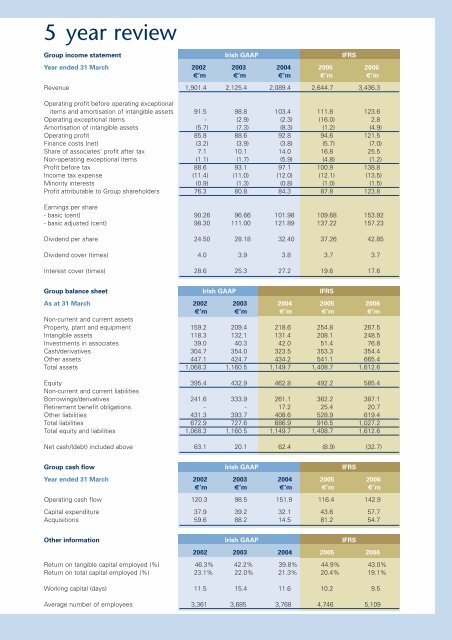
5 year reviewGroup income statement Irish GAAP IFRSYear ended 31 March 2002 2003 2004 2005 <strong>2006</strong>€’m €’m €’m €’m €’mRevenue 1,901.4 2,125.4 2,089.4 2,644.7 3,436.3Operating profit before operating exceptionalitems <strong>and</strong> amortisation of intangible assets 91.5 98.8 103.4 111.8 123.6Operating exceptional items - (2.9) (2.3) (16.0) 2.8Amortisation of intangible assets (5.7) (7.3) (8.3) (1.2) (4.9)Operating profit 85.8 88.6 92.8 94.6 121.5Finance costs (net) (3.2) (3.9) (3.8) (5.7) (7.0)Share of associates' profit after tax 7.1 10.1 14.0 16.8 25.5Non-operating exceptional items (1.1) (1.7) (5.9) (4.8) (1.2)Profit before tax 88.6 93.1 97.1 100.9 138.8Income tax expense (11.4) (11.0) (12.0) (12.1) (13.5)Minority interests (0.9) (1.3) (0.8) (1.0) (1.5)Profit attributable to Group shareholders 76.3 80.8 84.3 87.8 123.8Earnings per share- basic (cent) 90.26 96.66 101.98 109.68 153.92- basic adjusted (cent) 98.30 111.00 121.89 137.22 157.23Dividend per share 24.50 28.18 32.40 37.26 42.85Dividend cover (times) 4.0 3.9 3.8 3.7 3.7Interest cover (times) 28.6 25.3 27.2 19.6 17.6Group balance sheet Irish GAAP IFRSAs at 31 March 2002 2003 2004 2005 <strong>2006</strong>€’m €’m €’m €’m €’mNon-current <strong>and</strong> current assetsProperty, plant <strong>and</strong> equipment 159.2 209.4 218.6 254.8 267.5Intangible assets 118.3 132.1 131.4 208.1 248.5Investments in associates 39.0 40.3 42.0 51.4 76.8Cash/derivatives 304.7 354.0 323.5 353.3 354.4Other assets 447.1 424.7 434.2 541.1 665.4Total assets 1,068.3 1,160.5 1,149.7 1,408.7 1,612.6Equity 395.4 432.9 462.8 492.2 585.4Non-current <strong>and</strong> current liabilitiesBorrowings/derivatives 241.6 333.9 261.1 362.2 387.1Retirement benefit obligations - - 17.2 25.4 20.7Other liabilities 431.3 393.7 408.6 528.9 619.4Total liabilities 672.9 727.6 686.9 916.5 1,027.2Total equity <strong>and</strong> liabilities 1,068.3 1,160.5 1,149.7 1,408.7 1,612.6Net cash/(debt) included above 63.1 20.1 62.4 (8.9) (32.7)Group cash flow Irish GAAP IFRSYear ended 31 March 2002 2003 2004 2005 <strong>2006</strong>€’m €’m €’m €’m €’mOperating cash flow 120.3 98.5 151.9 116.4 142.9Capital expenditure 37.9 39.2 32.1 43.6 57.7Acquisitions 59.6 88.2 14.5 81.2 54.7Other information Irish GAAP IFRS2002 2003 2004 2005 <strong>2006</strong>Return on tangible capital employed (%) 46.3% 42.2% 39.8% 44.9% 43.0%Return on total capital employed (%) 23.1% 22.0% 21.3% 20.4% 19.1%Working capital (days) 11.5 15.4 11.6 10.2 9.5Average number of employees 3,361 3,685 3,768 4,746 5,109