e r 2 - Umgeni Water
e r 2 - Umgeni Water
e r 2 - Umgeni Water
- No tags were found...

You also want an ePaper? Increase the reach of your titles
YUMPU automatically turns print PDFs into web optimized ePapers that Google loves.
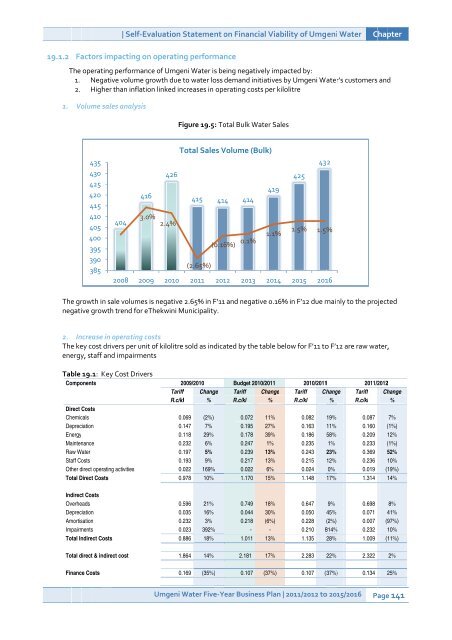
| Self-Evaluation Staatement onFinancialViabilityof<strong>Umgeni</strong>i <strong>Water</strong>Chapter19.1.2Factorsimpacting on operating performanceThe operatingperformancee of <strong>Umgeni</strong> <strong>Water</strong> iss beingg negatively impacted by:1. Negative voluvumegrowth due to water lossdemand initiatives by <strong>Umgeni</strong> <strong>Water</strong>’s customersandd2. Higherthan inflationn linkedd increasess in operatingg costsper kilolitre1.Volume sales analalysisFigure 19.5: TotalBulk <strong>Water</strong> Sales4354430442544204415441040544004395390385340420084264163.0% %2 2.4% %200992010Total Sales VoluVume(Bulk)419415414414(0.16%))(2.65%)2011120120. .1%20131.1% %20144251. .5%%20154321.5% %20168.0080%6.0060%4.0040%2.0020%0.0000%-2.00%-4.00%Thegrowth in sale volumes iss negative2.65%in F’111 andd negativee 0.16%in F’122 due mainlyto theprojectednegative growthtrendfor eThekwini Municipality.2. Increasee in opeeratingcostsThekey costdriverss per unit of o kilolitresold ass indicatedd byy thetablebelowforr F’11 too F’12 are rawwater,energy, stafff andimpairmentsTable19. 1: KeyCost DriversComponentsDirect CostsChemicalsDepreciationEnergyMaintenanceRaw <strong>Water</strong>Staff CostsOther direct operatingactivitiessTotal DirectCosts2009/2010Tariff f ChangeR.c/kl%0.0690.1470.1180.2320.1970.1930.0220.978(2%)7%29%6%5%9%169%%10%Budget 2010/2011TarifffChangeR.c/kl%0. 0720. 1950. 1780.2470.2390.2170. 0221. 17011%27%39%1%13%13%6%15%2010/20111TarifffChangeR.c/kll%0.0820. 1630. 1860.2350.2430.2150.0241. 14819%11%58%1%23%12%0%17%2011/20122TarifffR.c/klChange%0.0877%0.160(1%)0.20912%0.233(1%)0.36952%0.23610%0.019(19%)1.31414%Indirect CostsOverheadsDepreciationAmortisationImpairmentsTotal Indirect Costs0.5960.0350.2320.0230.88621%16%3%392%%18%0. 7490. 0440.218-1. 01118%30%(6%)-13%0.6470.0500.2280.2101. 1359%45%(2%)814%%28%0.6980.0710.0070.2321.0098%41%(97%)10%(11%)Total direct& indirect cost1.86414%2.18117%2.28322%2.3222%Finance Costs0.169(35%))0. 107(37%))0. 107(37%))0.13425%<strong>Umgeni</strong> <strong>Water</strong> Five-YearBusinessPlan | 2011/20122 too 2015/2016Pagee 141