e r 2 - Umgeni Water
e r 2 - Umgeni Water
e r 2 - Umgeni Water
- No tags were found...

You also want an ePaper? Increase the reach of your titles
YUMPU automatically turns print PDFs into web optimized ePapers that Google loves.
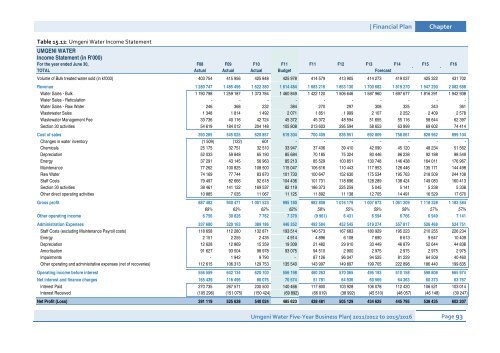
Table 15.12: <strong>Umgeni</strong> <strong>Water</strong> Income Statement| Financial Plan ChapterUMGENI WATERIncome Statement (in R'000)For the year ended June 30, F08 F09 F10 F11 F11 F12 F13 F14 F15 F16TOTAL Actual Actual Actual Budget ForecastVolume of Bulk treated water sold (in kl'000) 403 754 415 956 425 848 425 978 414 579 413 905 414 273 419 037 425 322 431 702Revenue 1 280 747 1 485 496 1 622 380 1 614 484 1 683 216 1 853 130 1 700 682 1 819 270 1 947 290 2 082 688<strong>Water</strong> Sales - Bulk 1 190 798 1 259 187 1 373 784 1 460 849 1 422 120 1 506 646 1 587 960 1 697 677 1 816 291 1 942 938<strong>Water</strong> Sales - Reticulation - - - - - - - - - -<strong>Water</strong> Sales - Raw <strong>Water</strong> 246 368 232 384 270 297 308 325 343 361Wastewater Sales 1 348 1 814 1 492 2 071 1 851 1 999 2 107 2 252 2 409 2 578Wastewater Management Fee 33 736 40 116 42 724 45 372 45 372 48 594 51 655 55 116 58 644 62 397Section 30 activities 54 619 184 012 204 148 105 808 213 603 295 594 58 653 63 899 69 602 74 414Cost of sales 393 265 545 025 620 857 619 304 700 409 836 951 692 809 758 061 828 962 899 104Changes in water inventory (1 509) (122) 601 - - - - - - -Chemicals 25 175 32 751 32 510 33 947 37 436 39 410 42 090 45 120 48 234 51 562Depreciation 52 033 59 848 65 190 85 684 70 185 75 324 80 446 86 238 92 188 98 549Energy 37 291 43 145 56 963 85 213 85 529 103 851 130 748 146 438 164 011 176 967Maintenance 77 262 100 825 108 500 115 047 106 616 110 443 117 953 126 446 135 171 144 498Raw <strong>Water</strong> 74 169 77 744 83 870 101 733 100 647 152 630 175 534 195 763 218 509 244 108Staff Costs 79 497 82 666 92 618 104 436 101 731 118 896 128 289 138 424 149 083 160 413Section 30 activities 38 461 141 132 169 537 82 119 186 373 225 259 5 045 5 141 5 238 5 338Other direct operating activities 10 885 7 035 11 067 11 125 11 892 11 138 12 705 14 491 16 529 17 670Gross profit 887 482 940 471 1 001 523 995 180 982 808 1 016 179 1 007 873 1 061 209 1 118 328 1 183 58469% 63% 62% 62% 58% 55% 59% 58% 57% 57%Other operating income 6 756 30 826 7 762 7 370 (9 961) 6 431 6 594 6 766 6 949 7 141Administration Expenses 337 680 329 163 389 186 446 352 492 584 452 545 519 274 557 817 526 468 524 751Staff Costs (excluding Maintenance Payroll costs) 118 658 112 280 132 871 193 514 140 573 167 683 180 929 195 223 210 255 226 234Energy 2 151 2 255 2 435 4 914 4 896 6 108 7 690 8 613 9 647 10 409Depreciation 12 628 12 869 15 359 19 309 21 482 29 910 33 449 46 879 52 644 44 838Amortisation 91 627 93 504 98 978 93 075 94 510 2 900 2 975 2 975 2 975 2 975Impairments - 1 942 9 790 - 87 126 96 047 94 525 81 229 64 509 40 460Other operating and administrative expenses (net of recoveries) 112 615 106 313 129 753 135 540 143 997 149 897 199 705 222 898 186 440 199 835Operating income before interest 556 559 642 134 620 100 556 198 480 263 570 065 495 193 510 158 598 808 665 974Net interest and finance charges 165 439 116 496 80 076 70 574 51 781 64 936 60 569 64 363 60 373 63 767Interest Paid 270 735 267 571 230 500 140 466 117 800 103 928 106 078 112 420 106 521 103 014Interest Received (105 296) (151 075) (150 424) (69 892) (66 019) (38 992) (45 510) (48 057) (46 148) (39 247)Net Profit (Loss) 391 119 525 638 540 024 485 623 428 481 505 129 434 625 445 795 538 435 602 207<strong>Umgeni</strong> <strong>Water</strong> Five-Year Business Plan| 2011/2012 to 2015/2016 Page 93