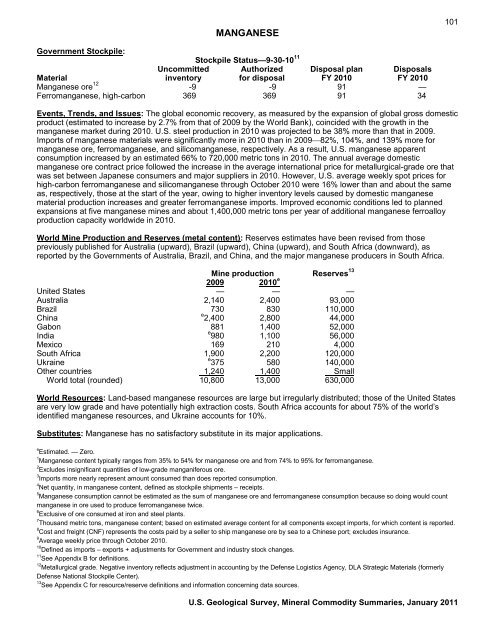
MANGANESE101Government Stockpile:Stockpile Status—9-30-10 11Uncommitted Authorized Disposal plan DisposalsMaterial inventory for disposal FY 2010 FY 2010Manganese ore 12 -9 -9 91 —Ferromanganese, high-carbon 369 369 91 34Events, Trends, <strong>and</strong> Issues: The global economic recovery, as measured by the expansion of global gross domesticproduct (estimated to increase by 2.7% from that of 2009 by the World Bank), coincided with the growth in themanganese market during 2010. U.S. steel production in 2010 was projected to be 38% more than that in 2009.Imports of manganese materials were significantly more in 2010 than in 2009⎯82%, 104%, <strong>and</strong> 139% more formanganese ore, ferromanganese, <strong>and</strong> silicomanganese, respectively. As a result, U.S. manganese apparentconsumption increased by an estimated 66% to 720,000 metric tons in 2010. The annual average domesticmanganese ore contract price followed the increase in the average international price for metallurgical-grade ore thatwas set between Japanese consumers <strong>and</strong> major suppliers in 2010. However, U.S. average weekly spot prices forhigh-carbon ferromanganese <strong>and</strong> silicomanganese through October 2010 were 16% lower than <strong>and</strong> about the sameas, respectively, those at the start of the year, owing to higher inventory levels caused by domestic manganesematerial production increases <strong>and</strong> greater ferromanganese imports. Improved economic conditions led to plannedexpansions at five manganese mines <strong>and</strong> about 1,400,000 metric tons per year of additional manganese ferroalloyproduction capacity worldwide in 2010.World Mine Production <strong>and</strong> Reserves (metal content): Reserves estimates have been revised from thosepreviously published for Australia (upward), Brazil (upward), China (upward), <strong>and</strong> South Africa (downward), asreported by the Governments of Australia, Brazil, <strong>and</strong> China, <strong>and</strong> the major manganese producers in South Africa.Mine production Reserves 132009 2010 eUnited States — — —Australia 2,140 2,400 93,000Brazil 730 830 110,000China2,400 2,800 44,000Gabon 881 1,400 52,000India980 1,100 56,000Mexico 169 210 4,000South Africa 1,900 2,200 120,000Ukraine375 580 140,000Other countries 1,240 1,400SmallWorld total (rounded) 10,800 13,000 630,000World Resources: L<strong>and</strong>-based manganese resources are large but irregularly distributed; those of the United Statesare very low grade <strong>and</strong> have potentially high extraction costs. South Africa accounts for about 75% of the world’sidentified manganese resources, <strong>and</strong> Ukraine accounts for 10%.Substitutes: Manganese has no satisfactory substitute in its major applications.e Estimated. — Zero.1 Manganese content typically ranges from 35% to 54% for manganese ore <strong>and</strong> from 74% to 95% for ferromanganese.2 Excludes insignificant quantities of low-grade manganiferous ore.3 Imports more nearly represent amount consumed than does reported consumption.4 Net quantity, in manganese content, defined as stockpile shipments – receipts.5 Manganese consumption cannot be estimated as the sum of manganese ore <strong>and</strong> ferromanganese consumption because so doing would countmanganese in ore used to produce ferromanganese twice.6 Exclusive of ore consumed at iron <strong>and</strong> steel plants.7 Thous<strong>and</strong> metric tons, manganese content; based on estimated average content for all components except imports, for which content is reported.8 Cost <strong>and</strong> freight (CNF) represents the costs paid by a seller to ship manganese ore by sea to a Chinese port; excludes insurance.9 Average weekly price through October 2010.10 Defined as imports – exports + adjustments for Government <strong>and</strong> industry stock changes.11 See Appendix B for definitions.12 Metallurgical grade. Negative inventory reflects adjustment in accounting by the Defense Logistics Agency, DLA Strategic Materials (formerlyDefense National Stockpile Center).13 See Appendix C for resource/reserve definitions <strong>and</strong> information concerning data sources.U.S. Geological Survey, <strong>Mineral</strong> <strong>Commodity</strong> <strong>Summaries</strong>, January <strong>2011</strong>
102MERCURY(Data in metric tons of mercury content unless otherwise noted) 1Domestic Production <strong>and</strong> Use: Mercury has not been produced as a principal commodity in the United States since1992, when the McDermitt Mine, in Humboldt County, NV, closed. In 2010, Mercury was produced as a byproductfrom processing gold-silver ore at several mines in Nevada; however, these production data were not reported.Secondary, or recycled, mercury was recovered by retorting end-of-use mercury-containing products that includedbatteries, compact <strong>and</strong> traditional fluorescent lamps, dental amalgam, medical devices, <strong>and</strong> thermostats, as well asmercury-contaminated soils. The mercury was processed <strong>and</strong> refined for resale or exported. Secondary mercuryproduction data were not reported. Mercury use is not carefully tracked in the United States; however, no more than100 metric tons per year of mercury were consumed domestically. The leading domestic end user of mercury was thechlorine-caustic soda industry. However, owing to mercury toxicity <strong>and</strong> concerns for human health, overall mercuryuse has declined in the United States. Mercury has been released to the environment from mercury-containing carswitches when the automobile is scrapped for recycling, from coal-fired powerplant emissions, <strong>and</strong> from incineratedmercury-containing medical devices. Mercury is no longer used in batteries <strong>and</strong> paints manufactured in the UnitedStates. Mercury was imported, refined, <strong>and</strong> then exported for global use in chlorine-caustic soda production, compact<strong>and</strong> traditional fluorescent lights, dental amalgam, neon lights, <strong>and</strong> small-scale gold mining. Some button-typebatteries, cleansers, fireworks, folk medicines, gr<strong>and</strong>father clocks, pesticides, <strong>and</strong> some skin-lightening creams <strong>and</strong>soaps may contain mercury.Salient Statistics—United States: 2006 2007 2008 2009 2010 eProduction:Mine (byproduct) NA NA NA NA NASecondary NA NA NA NA NAImports for consumption (gross weight), metal 94 67 155 206 200Exports (gross weight), metal 390 84 732 753 500Price, average value, dollars per flask, free market 2 670.00 530.00 600.00 600.00 900.00Net import reliance 3 as a percentage ofapparent consumption E E E E ERecycling: Six companies in the United States accounted for the majority of secondary mercury recycling <strong>and</strong>production in 2010. Mercury-containing automobile convenience switches, barometers, computers, dental amalgam,fluorescent lamps, medical devices, thermostats, <strong>and</strong> some mercury-containing toys were collected by as many as 50smaller companies <strong>and</strong> then the mercury-containing materials were shipped to larger companies for retorting <strong>and</strong>reclamation of the mercury. The increased use of nonmercury substitutes has resulted in a shrinking reservoir ofmercury-containing products for recycling.Import Sources (2006–09): Peru, 54%; Chile, 17%; Russia, 11%; Germany, 11%; <strong>and</strong> other, 7%.Tariff: Item Number Normal Trade Relations12-31-10Mercury 2805.40.0000 1.7% ad val.Depletion Allowance: 22% (Domestic), 14% (Foreign).Government Stockpile: An inventory of 4,436 tons of mercury was held at several sites in the United States;however, the Defense Logistics Agency, DLA Strategic Materials (formerly Defense National Stockpile Center) hasindicated that consolidated storage is preferred. An additional 1,329 tons of mercury was held by the U.S. Departmentof <strong>Energy</strong>, Oak Ridge, TN. Sales of mercury from the National Defense Stockpile remained suspended.Stockpile Status—9-30-10 4Uncommitted Authorized Disposal plan DisposalsMaterial inventory for disposal FY 2010 FY 2010Mercury 4,436 4,436 — —Prepared by William E. Brooks [(703) 648-7791, wbrooks@usgs.gov, fax: (703) 648-7757]
- Page 3:
U.S. Department of the InteriorKEN
- Page 6 and 7:
INTRODUCTION3Each chapter of the 20
- Page 8 and 9:
5NET EXPORTS OF MINERALRAW MATERIAL
- Page 10 and 11:
SIGNIFICANT EVENTS, TRENDS, AND ISS
- Page 12 and 13:
mineral materials valued at $1.30 b
- Page 14 and 15:
11MAJOR METAL-PRODUCING AREASAuB2P1
- Page 16 and 17:
13MAJOR INDUSTRIAL MINERAL-PRODUCIN
- Page 18 and 19:
ABRASIVES (MANUFACTURED)15Events, T
- Page 20 and 21:
ALUMINUM17The United States continu
- Page 22 and 23:
ANTIMONY19Events, Trends, and Issue
- Page 24 and 25:
ARSENIC21According to university me
- Page 26 and 27:
ASBESTOS23Events, Trends, and Issue
- Page 28 and 29:
BARITE25Nationally, the rig count o
- Page 30 and 31:
BAUXITE AND ALUMINA27Events, Trends
- Page 32 and 33:
BERYLLIUM29Events, Trends, and Issu
- Page 34 and 35:
BISMUTH31Events, Trends, and Issues
- Page 36 and 37:
BORON33Events, Trends, and Issues:
- Page 38 and 39:
BROMINE35Events, Trends, and Issues
- Page 40 and 41:
CADMIUM37NiCd battery use in consum
- Page 42 and 43:
CEMENT39The manufacture of clinker
- Page 44 and 45:
CESIUM41Events, Trends, and Issues:
- Page 46 and 47:
CHROMIUM43Stockpile Status—9-30-1
- Page 48 and 49:
CLAYS45Tariff: Item Number Normal T
- Page 50 and 51:
COBALT47Events, Trends, and Issues:
- Page 52 and 53:
COPPER49Events, Trends, and Issues:
- Page 54 and 55: DIAMOND (INDUSTRIAL)51Events, Trend
- Page 56 and 57: DIATOMITE53Events, Trends, and Issu
- Page 58 and 59: FELDSPAR55Feldspar use in tile and
- Page 60 and 61: FLUORSPAR57with planned output of 1
- Page 62 and 63: GALLIUM59In response to the unprece
- Page 64 and 65: GARNET (INDUSTRIAL)61Events, Trends
- Page 66 and 67: GEMSTONES63Events, Trends, and Issu
- Page 68 and 69: GERMANIUM65Events, Trends, and Issu
- Page 70 and 71: GOLD67With the increase in price of
- Page 72 and 73: GRAPHITE (NATURAL)69Events, Trends,
- Page 74 and 75: GYPSUM71Through 2010, more than 3,6
- Page 76 and 77: HELIUM73Events, Trends, and Issues:
- Page 78 and 79: INDIUM75China’s 21 indium produce
- Page 80 and 81: IODINE77Events, Trends, and Issues:
- Page 82 and 83: IRON AND STEEL79Events, Trends, and
- Page 84 and 85: IRON AND STEEL SCRAP81Tariff: Item
- Page 86 and 87: IRON AND STEEL SLAG83Events, Trends
- Page 88 and 89: IRON ORE85In 2009, China imported a
- Page 90 and 91: IRON OXIDE PIGMENTS87Events, Trends
- Page 92 and 93: KYANITE AND RELATED MATERIALS89Even
- Page 94 and 95: LEAD91caused by underground fires a
- Page 96 and 97: LIME93The lime industry is facing p
- Page 98 and 99: LITHIUM95market, and a facility at
- Page 100 and 101: MAGNESIUM COMPOUNDS97In Australia,
- Page 102 and 103: MAGNESIUM METAL99U.S. magnesium con
- Page 106 and 107: MERCURY103Events, Trends, and Issue
- Page 108 and 109: MICA (NATURAL)105Depletion Allowanc
- Page 110 and 111: MOLYBDENUM107Events, Trends, and Is
- Page 112 and 113: NICKEL109Nickel prices were adverse
- Page 114 and 115: NIOBIUM (COLUMBIUM)111Events, Trend
- Page 116 and 117: NITROGEN (FIXED)—AMMONIA113Accord
- Page 118 and 119: PEAT115Events, Trends, and Issues:
- Page 120 and 121: PERLITE117Events, Trends, and Issue
- Page 122 and 123: PHOSPHATE ROCK119Events, Trends, an
- Page 124 and 125: PLATINUM-GROUP METALS121Events, Tre
- Page 126 and 127: POTASH123Events, Trends, and Issues
- Page 128 and 129: PUMICE AND PUMICITE125Events, Trend
- Page 130 and 131: QUARTZ CRYSTAL (INDUSTRIAL)127Event
- Page 132 and 133: RARE EARTHS129Events, Trends, and I
- Page 134 and 135: RHENIUM131Events, Trends, and Issue
- Page 136 and 137: RUBIDIUM133Events, Trends, and Issu
- Page 138 and 139: SALT135Many chefs have advocated us
- Page 140 and 141: SAND AND GRAVEL (CONSTRUCTION)137Ev
- Page 142 and 143: SAND AND GRAVEL (INDUSTRIAL)139The
- Page 144 and 145: SCANDIUM141Scandium’s use in meta
- Page 146 and 147: SELENIUM143Events, Trends, and Issu
- Page 148 and 149: SILICON145Events, Trends, and Issue
- Page 150 and 151: SILVER147Silver was used as a repla
- Page 152 and 153: SODA ASH149A Wyoming soda ash produ
- Page 154 and 155:
SODIUM SULFATE151Events, Trends, an
- Page 156 and 157:
STONE (CRUSHED)153Events, Trends, a
- Page 158 and 159:
STONE (DIMENSION)155Events, Trends,
- Page 160 and 161:
STRONTIUM157Events, Trends, and Iss
- Page 162 and 163:
SULFUR159World sulfur production in
- Page 164 and 165:
TALC AND PYROPHYLLITE161Events, Tre
- Page 166 and 167:
TANTALUM163Events, Trends, and Issu
- Page 168 and 169:
TELLURIUM165Events, Trends, and Iss
- Page 170:
THALLIUM167Beginning in 2009, there
- Page 173 and 174:
170TIN(Data in metric tons of tin c
- Page 175 and 176:
172TITANIUM AND TITANIUM DIOXIDE 1(
- Page 177 and 178:
174TITANIUM MINERAL CONCENTRATES 1(
- Page 179 and 180:
176TUNGSTEN(Data in metric tons of
- Page 181 and 182:
178VANADIUM(Data in metric tons of
- Page 183 and 184:
180VERMICULITE(Data in thousand met
- Page 185 and 186:
182WOLLASTONITE(Data in metric tons
- Page 187 and 188:
184YTTRIUM 1(Data in metric tons of
- Page 189 and 190:
186ZEOLITES (NATURAL)(Data in metri
- Page 191 and 192:
188ZINC(Data in thousand metric ton
- Page 193 and 194:
190ZIRCONIUM AND HAFNIUM(Data in me
- Page 195 and 196:
192APPENDIX AAbbreviations and Unit
- Page 197 and 198:
194Demonstrated.—A term for the s
- Page 199 and 200:
196Part B—Sources of Reserves Dat
- Page 201:
198Europe and Central Eurasia—con