ALUMINUM17The United States continued to be reliant upon imports in 2010, as domestic primary production remained atsignificantly lower levels than in 2008, <strong>and</strong> exports continued to decline. Canada, China, <strong>and</strong> Russia accounted forabout 40% of total U.S. imports. U.S. exports decreased by 30% in 2010 compared with the amount exported in 2009.China, Canada, <strong>and</strong> Mexico, in descending order, received approximately 40% of total U.S. exports.The monthly average U.S. market price for primary ingot quoted by Platts Metals Week ranged between $0.934 perpound <strong>and</strong> $1.109 per pound throughout 2010. Prices on the London Metal Exchange (LME) followed the trend ofU.S. market prices.World primary aluminum production increased in 2010 compared with production in 2009, mainly as a result ofstarting new smelters <strong>and</strong> restarting smelters that had been shut down in 2008 <strong>and</strong> early in 2009. New smelters <strong>and</strong>restarted smelters were mainly in China, Qatar, <strong>and</strong> the United Arab Emirates. Smelters in Norway that shut downproduction during midyear 2009 remained closed in 2010. World inventories of metal held by producers, as reportedby the International Aluminium Institute, increased through the end of August to about 2.4 million tons from 2.2 milliontons at yearend 2009. Inventories of primary aluminum metal held by the LME worldwide decreased during the yearto 4.4 million tons at the end of September from 4.6 million tons at yearend 2009.World Smelter Production <strong>and</strong> Capacity:ProductionYearend capacity2009 2010 e 20092010 eUnited States 1,727 1,720 3,500 3,190Australia 1,940 1,950 2,050 2,050Bahrain 870 870 880 880Brazil 1,540 1,550 1,700 1,700Canada 3,030 2,920 3,090 3,020China 12,900 16,800 19,000 18,400Germany 292 370 620 620Icel<strong>and</strong> 785 780 790 790India 1,400 1,400 1,700 2,300Mozambique 545 550 570 570Norway 1,130 800 1,230 1,230Russia 3,820 3,850 4,280 4,280South Africa 809 800 900 900United Arab Emirates, Dubai 1,010 1,400 1,120 1,650Venezuela 610 440 625 590Other countries 4,900 5,200 6,7506,800World total (rounded) 37,300 41,400 48,800 49,000World Resources: Domestic aluminum requirements cannot be met by domestic bauxite resources. Domesticnonbauxitic aluminum resources are abundant <strong>and</strong> could meet domestic aluminum dem<strong>and</strong>. However, no processesfor using these resources have been proven economically competitive with those now used for bauxite. The worldreserves for bauxite are sufficient to meet world dem<strong>and</strong> for metal well into the future.Substitutes: Composites can substitute for aluminum in aircraft fuselages <strong>and</strong> wings. Glass, paper, plastics, <strong>and</strong>steel can substitute for aluminum in packaging. Magnesium, titanium, <strong>and</strong> steel can substitute for aluminum in groundtransportation <strong>and</strong> structural uses. Composites, steel, vinyl, <strong>and</strong> wood can substitute for aluminum in construction.Copper can replace aluminum in electrical applications.e Estimated. E Net exporter.1 See also Bauxite <strong>and</strong> Alumina.2 Domestic primary metal production + recovery from old aluminum scrap + net import reliance; excludes imported scrap.3 Includes aluminum alloy.4 Alumina <strong>and</strong> aluminum production workers (North American Industry Classification System—3313). Source: U.S. Department of Labor, Bureau ofLabor Statistics.5 Defined as imports – exports + adjustments for Government <strong>and</strong> industry stock changes.U.S. Geological Survey, <strong>Mineral</strong> <strong>Commodity</strong> <strong>Summaries</strong>, January <strong>2011</strong>
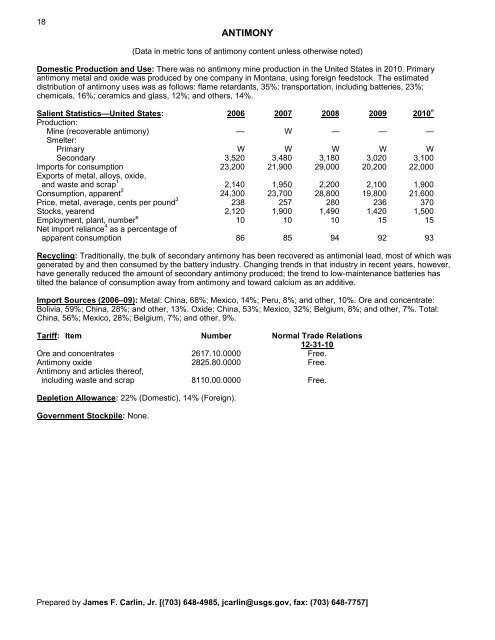
18ANTIMONY(Data in metric tons of antimony content unless otherwise noted)Domestic Production <strong>and</strong> Use: There was no antimony mine production in the United States in 2010. Primaryantimony metal <strong>and</strong> oxide was produced by one company in Montana, using foreign feedstock. The estimateddistribution of antimony uses was as follows: flame retardants, 35%; transportation, including batteries, 23%;chemicals, 16%; ceramics <strong>and</strong> glass, 12%; <strong>and</strong> others, 14%.Salient Statistics—United States: 2006 2007 2008 2009 2010 eProduction:Mine (recoverable antimony) –– W — — —Smelter:Primary W W W W WSecondary 3,520 3,480 3,180 3,020 3,100Imports for consumption 23,200 21,900 29,000 20,200 22,000Exports of metal, alloys, oxide,<strong>and</strong> waste <strong>and</strong> scrap 1 2,140 1,950 2,200 2,100 1,900Consumption, apparent 2 24,300 23,700 28,800 19,800 21,600Price, metal, average, cents per pound 3 238 257 280 236 370Stocks, yearend 2,120 1,900 1,490 1,420 1,500Employment, plant, number e 10 10 10 15 15Net import reliance 4 as a percentage ofapparent consumption 86 85 94 92 93Recycling: Traditionally, the bulk of secondary antimony has been recovered as antimonial lead, most of which wasgenerated by <strong>and</strong> then consumed by the battery industry. Changing trends in that industry in recent years, however,have generally reduced the amount of secondary antimony produced; the trend to low-maintenance batteries hastilted the balance of consumption away from antimony <strong>and</strong> toward calcium as an additive.Import Sources (2006–09): Metal: China, 68%; Mexico, 14%; Peru, 8%; <strong>and</strong> other, 10%. Ore <strong>and</strong> concentrate:Bolivia, 59%; China, 28%; <strong>and</strong> other, 13%. Oxide: China, 53%; Mexico, 32%; Belgium, 8%; <strong>and</strong> other, 7%. Total:China, 56%; Mexico, 28%; Belgium, 7%; <strong>and</strong> other, 9%.Tariff: Item Number Normal Trade Relations12-31-10Ore <strong>and</strong> concentrates 2617.10.0000 Free.Antimony oxide 2825.80.0000 Free.Antimony <strong>and</strong> articles thereof,including waste <strong>and</strong> scrap 8110.00.0000 Free.Depletion Allowance: 22% (Domestic), 14% (Foreign).Government Stockpile: None.Prepared by James F. Carlin, Jr. [(703) 648-4985, jcarlin@usgs.gov, fax: (703) 648-7757]
- Page 3: U.S. Department of the InteriorKEN
- Page 6 and 7: INTRODUCTION3Each chapter of the 20
- Page 8 and 9: 5NET EXPORTS OF MINERALRAW MATERIAL
- Page 10 and 11: SIGNIFICANT EVENTS, TRENDS, AND ISS
- Page 12 and 13: mineral materials valued at $1.30 b
- Page 14 and 15: 11MAJOR METAL-PRODUCING AREASAuB2P1
- Page 16 and 17: 13MAJOR INDUSTRIAL MINERAL-PRODUCIN
- Page 18 and 19: ABRASIVES (MANUFACTURED)15Events, T
- Page 22 and 23: ANTIMONY19Events, Trends, and Issue
- Page 24 and 25: ARSENIC21According to university me
- Page 26 and 27: ASBESTOS23Events, Trends, and Issue
- Page 28 and 29: BARITE25Nationally, the rig count o
- Page 30 and 31: BAUXITE AND ALUMINA27Events, Trends
- Page 32 and 33: BERYLLIUM29Events, Trends, and Issu
- Page 34 and 35: BISMUTH31Events, Trends, and Issues
- Page 36 and 37: BORON33Events, Trends, and Issues:
- Page 38 and 39: BROMINE35Events, Trends, and Issues
- Page 40 and 41: CADMIUM37NiCd battery use in consum
- Page 42 and 43: CEMENT39The manufacture of clinker
- Page 44 and 45: CESIUM41Events, Trends, and Issues:
- Page 46 and 47: CHROMIUM43Stockpile Status—9-30-1
- Page 48 and 49: CLAYS45Tariff: Item Number Normal T
- Page 50 and 51: COBALT47Events, Trends, and Issues:
- Page 52 and 53: COPPER49Events, Trends, and Issues:
- Page 54 and 55: DIAMOND (INDUSTRIAL)51Events, Trend
- Page 56 and 57: DIATOMITE53Events, Trends, and Issu
- Page 58 and 59: FELDSPAR55Feldspar use in tile and
- Page 60 and 61: FLUORSPAR57with planned output of 1
- Page 62 and 63: GALLIUM59In response to the unprece
- Page 64 and 65: GARNET (INDUSTRIAL)61Events, Trends
- Page 66 and 67: GEMSTONES63Events, Trends, and Issu
- Page 68 and 69: GERMANIUM65Events, Trends, and Issu
- Page 70 and 71:
GOLD67With the increase in price of
- Page 72 and 73:
GRAPHITE (NATURAL)69Events, Trends,
- Page 74 and 75:
GYPSUM71Through 2010, more than 3,6
- Page 76 and 77:
HELIUM73Events, Trends, and Issues:
- Page 78 and 79:
INDIUM75China’s 21 indium produce
- Page 80 and 81:
IODINE77Events, Trends, and Issues:
- Page 82 and 83:
IRON AND STEEL79Events, Trends, and
- Page 84 and 85:
IRON AND STEEL SCRAP81Tariff: Item
- Page 86 and 87:
IRON AND STEEL SLAG83Events, Trends
- Page 88 and 89:
IRON ORE85In 2009, China imported a
- Page 90 and 91:
IRON OXIDE PIGMENTS87Events, Trends
- Page 92 and 93:
KYANITE AND RELATED MATERIALS89Even
- Page 94 and 95:
LEAD91caused by underground fires a
- Page 96 and 97:
LIME93The lime industry is facing p
- Page 98 and 99:
LITHIUM95market, and a facility at
- Page 100 and 101:
MAGNESIUM COMPOUNDS97In Australia,
- Page 102 and 103:
MAGNESIUM METAL99U.S. magnesium con
- Page 104 and 105:
MANGANESE101Government Stockpile:St
- Page 106 and 107:
MERCURY103Events, Trends, and Issue
- Page 108 and 109:
MICA (NATURAL)105Depletion Allowanc
- Page 110 and 111:
MOLYBDENUM107Events, Trends, and Is
- Page 112 and 113:
NICKEL109Nickel prices were adverse
- Page 114 and 115:
NIOBIUM (COLUMBIUM)111Events, Trend
- Page 116 and 117:
NITROGEN (FIXED)—AMMONIA113Accord
- Page 118 and 119:
PEAT115Events, Trends, and Issues:
- Page 120 and 121:
PERLITE117Events, Trends, and Issue
- Page 122 and 123:
PHOSPHATE ROCK119Events, Trends, an
- Page 124 and 125:
PLATINUM-GROUP METALS121Events, Tre
- Page 126 and 127:
POTASH123Events, Trends, and Issues
- Page 128 and 129:
PUMICE AND PUMICITE125Events, Trend
- Page 130 and 131:
QUARTZ CRYSTAL (INDUSTRIAL)127Event
- Page 132 and 133:
RARE EARTHS129Events, Trends, and I
- Page 134 and 135:
RHENIUM131Events, Trends, and Issue
- Page 136 and 137:
RUBIDIUM133Events, Trends, and Issu
- Page 138 and 139:
SALT135Many chefs have advocated us
- Page 140 and 141:
SAND AND GRAVEL (CONSTRUCTION)137Ev
- Page 142 and 143:
SAND AND GRAVEL (INDUSTRIAL)139The
- Page 144 and 145:
SCANDIUM141Scandium’s use in meta
- Page 146 and 147:
SELENIUM143Events, Trends, and Issu
- Page 148 and 149:
SILICON145Events, Trends, and Issue
- Page 150 and 151:
SILVER147Silver was used as a repla
- Page 152 and 153:
SODA ASH149A Wyoming soda ash produ
- Page 154 and 155:
SODIUM SULFATE151Events, Trends, an
- Page 156 and 157:
STONE (CRUSHED)153Events, Trends, a
- Page 158 and 159:
STONE (DIMENSION)155Events, Trends,
- Page 160 and 161:
STRONTIUM157Events, Trends, and Iss
- Page 162 and 163:
SULFUR159World sulfur production in
- Page 164 and 165:
TALC AND PYROPHYLLITE161Events, Tre
- Page 166 and 167:
TANTALUM163Events, Trends, and Issu
- Page 168 and 169:
TELLURIUM165Events, Trends, and Iss
- Page 170:
THALLIUM167Beginning in 2009, there
- Page 173 and 174:
170TIN(Data in metric tons of tin c
- Page 175 and 176:
172TITANIUM AND TITANIUM DIOXIDE 1(
- Page 177 and 178:
174TITANIUM MINERAL CONCENTRATES 1(
- Page 179 and 180:
176TUNGSTEN(Data in metric tons of
- Page 181 and 182:
178VANADIUM(Data in metric tons of
- Page 183 and 184:
180VERMICULITE(Data in thousand met
- Page 185 and 186:
182WOLLASTONITE(Data in metric tons
- Page 187 and 188:
184YTTRIUM 1(Data in metric tons of
- Page 189 and 190:
186ZEOLITES (NATURAL)(Data in metri
- Page 191 and 192:
188ZINC(Data in thousand metric ton
- Page 193 and 194:
190ZIRCONIUM AND HAFNIUM(Data in me
- Page 195 and 196:
192APPENDIX AAbbreviations and Unit
- Page 197 and 198:
194Demonstrated.—A term for the s
- Page 199 and 200:
196Part B—Sources of Reserves Dat
- Page 201:
198Europe and Central Eurasia—con