CLAYS45Tariff: Item Number Normal Trade Relations12-31-10Kaolin <strong>and</strong> other kaolinitic clays,whether or not calcined 2507.00.0000 Free.Bentonite 2508.10.0000 Free.Fire clay 2508.30.0000 Free.Common blue clay <strong>and</strong> other ball clays 2508.40.0110 Free.Decolorizing <strong>and</strong> fuller’s earths 2508.40.0120 Free.Other clays 2508.40.0150 Free.Chamotte or dina’s earth 2508.70.0000 Free.Activated clays <strong>and</strong> earths 3802.90.2000 2.5% ad val.Exp<strong>and</strong>ed clays <strong>and</strong> other mixtures 6806.20.0000 Free.Depletion Allowance: Ball clay, bentonite, fire clay, fuller’s earth, <strong>and</strong> kaolin, 14% (Domestic <strong>and</strong> foreign); clay usedin the manufacture of common brick, lightweight aggregate, <strong>and</strong> sewer pipe, 7.5% (Domestic <strong>and</strong> foreign); clay usedin the manufacture of drain <strong>and</strong> roofing tile, flower pots, <strong>and</strong> kindred products, 5% (Domestic <strong>and</strong> foreign); clay fromwhich alumina <strong>and</strong> aluminum compounds are extracted, 22% (Domestic); <strong>and</strong> ball clay, bentonite, china clay, saggerclay, <strong>and</strong> clay used or sold for use dependent on its refractory properties, 14% (Domestic).Government Stockpile: None.Events, Trends, <strong>and</strong> Issues: Many markets for clays improved in 2010 as the U.S. economy began to recover fromthe recession, which began in 2008. A slight improvement in commercial <strong>and</strong> private housing construction resulted inincreased sales of ball clay <strong>and</strong> common clay. Bentonite sales increased with greater dem<strong>and</strong> from the oil drilling,foundry, <strong>and</strong> iron ore industries. Kaolin production improved because of a slight recovery in world paper markets <strong>and</strong>greater construction activity. Fuller’s earth <strong>and</strong> kaolin sales increased mainly on the strength of increased exports.World Mine Production <strong>and</strong> Reserves: 6 Reserves are large in major producing countries, but data are not available.Mine productionBentonite Fuller’s earth Kaolin2009 2010 e 2009 2010 e 2009 2010 eUnited States (sales) 3,650 4,0002,0102,300 5,290 5,700Brazil (beneficiated) 239 245 — — 2,680 2,750Czech Republic (crude) 116 120 — — 2,890 2,950Germany (sales) 350 380 — — 3,200 3,250Greece (crude) 845 860 — — — —Italy 146 150 3 3 1,070 1,000Mexico 511 520 108 110 78 80Spain 155 165 820 830 465 470Turkey 1,000 1,050 — — 800 850Ukraine (crude) 300 320 — — 1,120 1,150United Kingdom — — — — 1,800 1,850Uzbekistan (crude) — — — — 5,500 5,550Other countries 2,350 2,400 259 285 8,140 8,400World total (rounded) 9,660 10,000 3,200 3,500 33,000 34,000World Resources: Resources of all clays are extremely large.Substitutes: Clays compete with calcium carbonate in many filler <strong>and</strong> extender applications. For pet litter, clayscompete with other mineral-based litters such as those manufactured using diatomite <strong>and</strong> zeolite; organic litters madefrom shredded corn stalks <strong>and</strong> paper, straw, <strong>and</strong> wood shavings; <strong>and</strong> litters made using silica gel. As an oilabsorbent, clays compete mainly with diatomite, zeolite, <strong>and</strong> a variety of polymer <strong>and</strong> natural organic products.e Estimated. E Net exporter. — Zero.1 Excludes Puerto Rico.2 Excludes attapulgite.3 Data may not add to totals shown because of independent rounding.4 Also includes some refractory-grade kaolin.5 Defined as imports – exports.6 See Appendix C for resource/reserve definitions <strong>and</strong> information concerning data sources.U.S. Geological Survey, <strong>Mineral</strong> <strong>Commodity</strong> <strong>Summaries</strong>, January <strong>2011</strong>
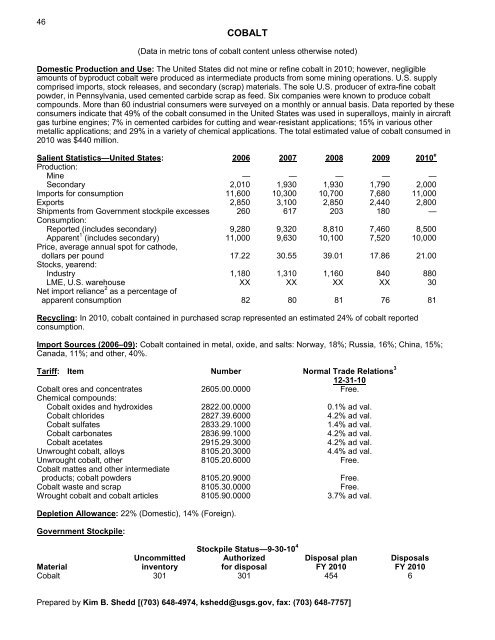
46COBALT(Data in metric tons of cobalt content unless otherwise noted)Domestic Production <strong>and</strong> Use: The United States did not mine or refine cobalt in 2010; however, negligibleamounts of byproduct cobalt were produced as intermediate products from some mining operations. U.S. supplycomprised imports, stock releases, <strong>and</strong> secondary (scrap) materials. The sole U.S. producer of extra-fine cobaltpowder, in Pennsylvania, used cemented carbide scrap as feed. Six companies were known to produce cobaltcompounds. More than 60 industrial consumers were surveyed on a monthly or annual basis. Data reported by theseconsumers indicate that 49% of the cobalt consumed in the United States was used in superalloys, mainly in aircraftgas turbine engines; 7% in cemented carbides for cutting <strong>and</strong> wear-resistant applications; 15% in various othermetallic applications; <strong>and</strong> 29% in a variety of chemical applications. The total estimated value of cobalt consumed in2010 was $440 million.Salient Statistics—United States: 2006 2007 2008 2009 2010 eProduction:Mine — — — — —Secondary 2,010 1,930 1,930 1,790 2,000Imports for consumption 11,600 10,300 10,700 7,680 11,000Exports 2,850 3,100 2,850 2,440 2,800Shipments from Government stockpile excesses 260 617 203 180 —Consumption:Reported (includes secondary) 9,280 9,320 8,810 7,460 8,500Apparent 1 (includes secondary) 11,000 9,630 10,100 7,520 10,000Price, average annual spot for cathode,dollars per pound 17.22 30.55 39.01 17.86 21.00Stocks, yearend:Industry 1,180 1,310 1,160 840 880LME, U.S. warehouse XX XX XX XX 30Net import reliance 2 as a percentage ofapparent consumption 82 80 81 76 81Recycling: In 2010, cobalt contained in purchased scrap represented an estimated 24% of cobalt reportedconsumption.Import Sources (2006–09): Cobalt contained in metal, oxide, <strong>and</strong> salts: Norway, 18%; Russia, 16%; China, 15%;Canada, 11%; <strong>and</strong> other, 40%.Tariff: Item Number Normal Trade Relations 312-31-10Cobalt ores <strong>and</strong> concentrates 2605.00.0000 Free.Chemical compounds:Cobalt oxides <strong>and</strong> hydroxides 2822.00.0000 0.1% ad val.Cobalt chlorides 2827.39.6000 4.2% ad val.Cobalt sulfates 2833.29.1000 1.4% ad val.Cobalt carbonates 2836.99.1000 4.2% ad val.Cobalt acetates 2915.29.3000 4.2% ad val.Unwrought cobalt, alloys 8105.20.3000 4.4% ad val.Unwrought cobalt, other 8105.20.6000 Free.Cobalt mattes <strong>and</strong> other intermediateproducts; cobalt powders 8105.20.9000 Free.Cobalt waste <strong>and</strong> scrap 8105.30.0000 Free.Wrought cobalt <strong>and</strong> cobalt articles 8105.90.0000 3.7% ad val.Depletion Allowance: 22% (Domestic), 14% (Foreign).Government Stockpile:Stockpile Status—9-30-10 4Uncommitted Authorized Disposal plan DisposalsMaterial inventory for disposal FY 2010 FY 2010Cobalt 301 301 454 6Prepared by Kim B. Shedd [(703) 648-4974, kshedd@usgs.gov, fax: (703) 648-7757]
- Page 3: U.S. Department of the InteriorKEN
- Page 6 and 7: INTRODUCTION3Each chapter of the 20
- Page 8 and 9: 5NET EXPORTS OF MINERALRAW MATERIAL
- Page 10 and 11: SIGNIFICANT EVENTS, TRENDS, AND ISS
- Page 12 and 13: mineral materials valued at $1.30 b
- Page 14 and 15: 11MAJOR METAL-PRODUCING AREASAuB2P1
- Page 16 and 17: 13MAJOR INDUSTRIAL MINERAL-PRODUCIN
- Page 18 and 19: ABRASIVES (MANUFACTURED)15Events, T
- Page 20 and 21: ALUMINUM17The United States continu
- Page 22 and 23: ANTIMONY19Events, Trends, and Issue
- Page 24 and 25: ARSENIC21According to university me
- Page 26 and 27: ASBESTOS23Events, Trends, and Issue
- Page 28 and 29: BARITE25Nationally, the rig count o
- Page 30 and 31: BAUXITE AND ALUMINA27Events, Trends
- Page 32 and 33: BERYLLIUM29Events, Trends, and Issu
- Page 34 and 35: BISMUTH31Events, Trends, and Issues
- Page 36 and 37: BORON33Events, Trends, and Issues:
- Page 38 and 39: BROMINE35Events, Trends, and Issues
- Page 40 and 41: CADMIUM37NiCd battery use in consum
- Page 42 and 43: CEMENT39The manufacture of clinker
- Page 44 and 45: CESIUM41Events, Trends, and Issues:
- Page 46 and 47: CHROMIUM43Stockpile Status—9-30-1
- Page 50 and 51: COBALT47Events, Trends, and Issues:
- Page 52 and 53: COPPER49Events, Trends, and Issues:
- Page 54 and 55: DIAMOND (INDUSTRIAL)51Events, Trend
- Page 56 and 57: DIATOMITE53Events, Trends, and Issu
- Page 58 and 59: FELDSPAR55Feldspar use in tile and
- Page 60 and 61: FLUORSPAR57with planned output of 1
- Page 62 and 63: GALLIUM59In response to the unprece
- Page 64 and 65: GARNET (INDUSTRIAL)61Events, Trends
- Page 66 and 67: GEMSTONES63Events, Trends, and Issu
- Page 68 and 69: GERMANIUM65Events, Trends, and Issu
- Page 70 and 71: GOLD67With the increase in price of
- Page 72 and 73: GRAPHITE (NATURAL)69Events, Trends,
- Page 74 and 75: GYPSUM71Through 2010, more than 3,6
- Page 76 and 77: HELIUM73Events, Trends, and Issues:
- Page 78 and 79: INDIUM75China’s 21 indium produce
- Page 80 and 81: IODINE77Events, Trends, and Issues:
- Page 82 and 83: IRON AND STEEL79Events, Trends, and
- Page 84 and 85: IRON AND STEEL SCRAP81Tariff: Item
- Page 86 and 87: IRON AND STEEL SLAG83Events, Trends
- Page 88 and 89: IRON ORE85In 2009, China imported a
- Page 90 and 91: IRON OXIDE PIGMENTS87Events, Trends
- Page 92 and 93: KYANITE AND RELATED MATERIALS89Even
- Page 94 and 95: LEAD91caused by underground fires a
- Page 96 and 97: LIME93The lime industry is facing p
- Page 98 and 99:
LITHIUM95market, and a facility at
- Page 100 and 101:
MAGNESIUM COMPOUNDS97In Australia,
- Page 102 and 103:
MAGNESIUM METAL99U.S. magnesium con
- Page 104 and 105:
MANGANESE101Government Stockpile:St
- Page 106 and 107:
MERCURY103Events, Trends, and Issue
- Page 108 and 109:
MICA (NATURAL)105Depletion Allowanc
- Page 110 and 111:
MOLYBDENUM107Events, Trends, and Is
- Page 112 and 113:
NICKEL109Nickel prices were adverse
- Page 114 and 115:
NIOBIUM (COLUMBIUM)111Events, Trend
- Page 116 and 117:
NITROGEN (FIXED)—AMMONIA113Accord
- Page 118 and 119:
PEAT115Events, Trends, and Issues:
- Page 120 and 121:
PERLITE117Events, Trends, and Issue
- Page 122 and 123:
PHOSPHATE ROCK119Events, Trends, an
- Page 124 and 125:
PLATINUM-GROUP METALS121Events, Tre
- Page 126 and 127:
POTASH123Events, Trends, and Issues
- Page 128 and 129:
PUMICE AND PUMICITE125Events, Trend
- Page 130 and 131:
QUARTZ CRYSTAL (INDUSTRIAL)127Event
- Page 132 and 133:
RARE EARTHS129Events, Trends, and I
- Page 134 and 135:
RHENIUM131Events, Trends, and Issue
- Page 136 and 137:
RUBIDIUM133Events, Trends, and Issu
- Page 138 and 139:
SALT135Many chefs have advocated us
- Page 140 and 141:
SAND AND GRAVEL (CONSTRUCTION)137Ev
- Page 142 and 143:
SAND AND GRAVEL (INDUSTRIAL)139The
- Page 144 and 145:
SCANDIUM141Scandium’s use in meta
- Page 146 and 147:
SELENIUM143Events, Trends, and Issu
- Page 148 and 149:
SILICON145Events, Trends, and Issue
- Page 150 and 151:
SILVER147Silver was used as a repla
- Page 152 and 153:
SODA ASH149A Wyoming soda ash produ
- Page 154 and 155:
SODIUM SULFATE151Events, Trends, an
- Page 156 and 157:
STONE (CRUSHED)153Events, Trends, a
- Page 158 and 159:
STONE (DIMENSION)155Events, Trends,
- Page 160 and 161:
STRONTIUM157Events, Trends, and Iss
- Page 162 and 163:
SULFUR159World sulfur production in
- Page 164 and 165:
TALC AND PYROPHYLLITE161Events, Tre
- Page 166 and 167:
TANTALUM163Events, Trends, and Issu
- Page 168 and 169:
TELLURIUM165Events, Trends, and Iss
- Page 170:
THALLIUM167Beginning in 2009, there
- Page 173 and 174:
170TIN(Data in metric tons of tin c
- Page 175 and 176:
172TITANIUM AND TITANIUM DIOXIDE 1(
- Page 177 and 178:
174TITANIUM MINERAL CONCENTRATES 1(
- Page 179 and 180:
176TUNGSTEN(Data in metric tons of
- Page 181 and 182:
178VANADIUM(Data in metric tons of
- Page 183 and 184:
180VERMICULITE(Data in thousand met
- Page 185 and 186:
182WOLLASTONITE(Data in metric tons
- Page 187 and 188:
184YTTRIUM 1(Data in metric tons of
- Page 189 and 190:
186ZEOLITES (NATURAL)(Data in metri
- Page 191 and 192:
188ZINC(Data in thousand metric ton
- Page 193 and 194:
190ZIRCONIUM AND HAFNIUM(Data in me
- Page 195 and 196:
192APPENDIX AAbbreviations and Unit
- Page 197 and 198:
194Demonstrated.—A term for the s
- Page 199 and 200:
196Part B—Sources of Reserves Dat
- Page 201:
198Europe and Central Eurasia—con