GEMSTONES63Events, Trends, <strong>and</strong> Issues: In 2010, the U.S. market for gem-quality diamonds was estimated to be about $18billion, accounting for more than 35% of world dem<strong>and</strong>. This was an increase of about 42% compared with that of2009. The domestic market for natural, nondiamond gemstones was estimated to be about $946 million, which wasan increase of 21% from that of 2009. These increases in the U.S. gemstone markets are a reflection ofimprovements in the economy since the global recession, <strong>and</strong> its impact on luxury spending. The United States isexpected to continue dominating global gemstone consumption.World Gem Diamond Mine Production 6 <strong>and</strong> Reserves:Mine production Reserves 72009 2010 eAngola 8,100 8,100 World reserves of diamond-bearingAustralia 60 60 deposits are substantial. No reservesBotswana 24,000 24,000 data are available for other gemstones.Brazil 182 180Canada 10,900 11,000Central African Republic 300 300China 100 100Congo (Kinshasa) 3,600 3,600Côte d’Ivoire 210 210Ghana 500 500Guinea 2,400 2,400Guyana 179 180Lesotho 450 450Namibia 2,300 2,300Russia 17,800 18,000Sierra Leone 200 200South Africa 2,400 2,400Tanzania 150 150Other countries 8 270270World total (rounded) 74,100 74,000World Resources: Most diamond-bearing ore bodies have a diamond content that ranges from less than 1 carat perton to about 6 carats per ton. The major gem diamond reserves are in southern Africa, Australia, Canada, <strong>and</strong>Russia.Substitutes: Plastics, glass, <strong>and</strong> other materials are substituted for natural gemstones. Synthetic gemstones(manufactured materials that have the same chemical <strong>and</strong> physical properties as gemstones) are commonsubstitutes. Simulants (materials that appear to be gems, but differ in chemical <strong>and</strong> physical characteristics) also arefrequently substituted for natural gemstones.e Estimated.1 Excludes industrial diamond <strong>and</strong> garnet. See Diamond (Industrial) <strong>and</strong> Garnet (Industrial).2 Estimated minimum production.3 Includes production of freshwater shell.4 Reexports account for about 78% of the totals.5 Defined as imports – exports <strong>and</strong> reexports + adjustments for Government <strong>and</strong> industry stock changes.6 Data in thous<strong>and</strong>s of carats of gem diamond.7 See Appendix C for resource/reserve definitions <strong>and</strong> information concerning data sources.8 In addition to countries listed, Cameroon, Congo (Brazzaville), Gabon, India, Indonesia, Liberia, Togo, Venezuela, <strong>and</strong> Zimbabwe are known toproduce gem diamonds.U.S. Geological Survey, <strong>Mineral</strong> <strong>Commodity</strong> <strong>Summaries</strong>, January <strong>2011</strong>
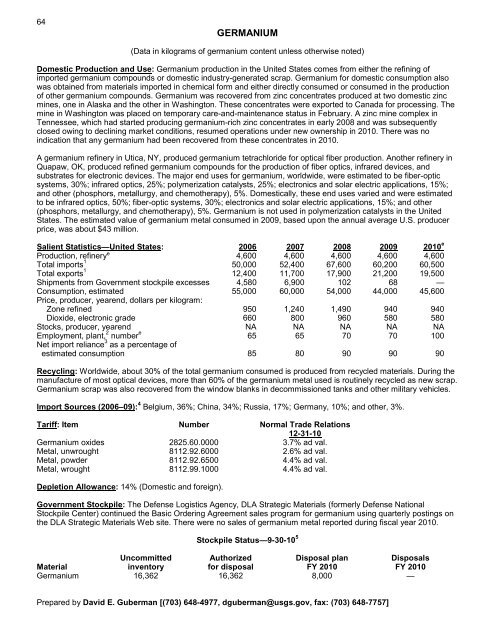
64GERMANIUM(Data in kilograms of germanium content unless otherwise noted)Domestic Production <strong>and</strong> Use: Germanium production in the United States comes from either the refining ofimported germanium compounds or domestic industry-generated scrap. Germanium for domestic consumption alsowas obtained from materials imported in chemical form <strong>and</strong> either directly consumed or consumed in the productionof other germanium compounds. Germanium was recovered from zinc concentrates produced at two domestic zincmines, one in Alaska <strong>and</strong> the other in Washington. These concentrates were exported to Canada for processing. Themine in Washington was placed on temporary care-<strong>and</strong>-maintenance status in February. A zinc mine complex inTennessee, which had started producing germanium-rich zinc concentrates in early 2008 <strong>and</strong> was subsequentlyclosed owing to declining market conditions, resumed operations under new ownership in 2010. There was noindication that any germanium had been recovered from these concentrates in 2010.A germanium refinery in Utica, NY, produced germanium tetrachloride for optical fiber production. Another refinery inQuapaw, OK, produced refined germanium compounds for the production of fiber optics, infrared devices, <strong>and</strong>substrates for electronic devices. The major end uses for germanium, worldwide, were estimated to be fiber-opticsystems, 30%; infrared optics, 25%; polymerization catalysts, 25%; electronics <strong>and</strong> solar electric applications, 15%;<strong>and</strong> other (phosphors, metallurgy, <strong>and</strong> chemotherapy), 5%. Domestically, these end uses varied <strong>and</strong> were estimatedto be infrared optics, 50%; fiber-optic systems, 30%; electronics <strong>and</strong> solar electric applications, 15%; <strong>and</strong> other(phosphors, metallurgy, <strong>and</strong> chemotherapy), 5%. Germanium is not used in polymerization catalysts in the UnitedStates. The estimated value of germanium metal consumed in 2009, based upon the annual average U.S. producerprice, was about $43 million.Salient Statistics—United States: 2006 2007 2008 2009 2010 eProduction, refinery e 4,600 4,600 4,600 4,600 4,600Total imports 1 50,000 52,400 67,600 60,200 60,500Total exports 1 12,400 11,700 17,900 21,200 19,500Shipments from Government stockpile excesses 4,580 6,900 102 68 —Consumption, estimated 55,000 60,000 54,000 44,000 45,600Price, producer, yearend, dollars per kilogram:Zone refined 950 1,240 1,490 940 940Dioxide, electronic grade 660 800 960 580 580Stocks, producer, yearend NA NA NA NA NAEmployment, plant, 2 number e 65 65 70 70 100Net import reliance 3 as a percentage ofestimated consumption 85 80 90 90 90Recycling: Worldwide, about 30% of the total germanium consumed is produced from recycled materials. During themanufacture of most optical devices, more than 60% of the germanium metal used is routinely recycled as new scrap.Germanium scrap was also recovered from the window blanks in decommissioned tanks <strong>and</strong> other military vehicles.Import Sources (2006–09): 4 Belgium, 36%; China, 34%; Russia, 17%; Germany, 10%; <strong>and</strong> other, 3%.Tariff: Item Number Normal Trade Relations12-31-10Germanium oxides 2825.60.0000 3.7% ad val.Metal, unwrought 8112.92.6000 2.6% ad val.Metal, powder 8112.92.6500 4.4% ad val.Metal, wrought 8112.99.1000 4.4% ad val.Depletion Allowance: 14% (Domestic <strong>and</strong> foreign).Government Stockpile: The Defense Logistics Agency, DLA Strategic Materials (formerly Defense NationalStockpile Center) continued the Basic Ordering Agreement sales program for germanium using quarterly postings onthe DLA Strategic Materials Web site. There were no sales of germanium metal reported during fiscal year 2010.Stockpile Status—9-30-10 5Uncommitted Authorized Disposal plan DisposalsMaterial inventory for disposal FY 2010 FY 2010Germanium 16,362 16,362 8,000 —Prepared by David E. Guberman [(703) 648-4977, dguberman@usgs.gov, fax: (703) 648-7757]
- Page 3:
U.S. Department of the InteriorKEN
- Page 6 and 7:
INTRODUCTION3Each chapter of the 20
- Page 8 and 9:
5NET EXPORTS OF MINERALRAW MATERIAL
- Page 10 and 11:
SIGNIFICANT EVENTS, TRENDS, AND ISS
- Page 12 and 13:
mineral materials valued at $1.30 b
- Page 14 and 15:
11MAJOR METAL-PRODUCING AREASAuB2P1
- Page 16 and 17: 13MAJOR INDUSTRIAL MINERAL-PRODUCIN
- Page 18 and 19: ABRASIVES (MANUFACTURED)15Events, T
- Page 20 and 21: ALUMINUM17The United States continu
- Page 22 and 23: ANTIMONY19Events, Trends, and Issue
- Page 24 and 25: ARSENIC21According to university me
- Page 26 and 27: ASBESTOS23Events, Trends, and Issue
- Page 28 and 29: BARITE25Nationally, the rig count o
- Page 30 and 31: BAUXITE AND ALUMINA27Events, Trends
- Page 32 and 33: BERYLLIUM29Events, Trends, and Issu
- Page 34 and 35: BISMUTH31Events, Trends, and Issues
- Page 36 and 37: BORON33Events, Trends, and Issues:
- Page 38 and 39: BROMINE35Events, Trends, and Issues
- Page 40 and 41: CADMIUM37NiCd battery use in consum
- Page 42 and 43: CEMENT39The manufacture of clinker
- Page 44 and 45: CESIUM41Events, Trends, and Issues:
- Page 46 and 47: CHROMIUM43Stockpile Status—9-30-1
- Page 48 and 49: CLAYS45Tariff: Item Number Normal T
- Page 50 and 51: COBALT47Events, Trends, and Issues:
- Page 52 and 53: COPPER49Events, Trends, and Issues:
- Page 54 and 55: DIAMOND (INDUSTRIAL)51Events, Trend
- Page 56 and 57: DIATOMITE53Events, Trends, and Issu
- Page 58 and 59: FELDSPAR55Feldspar use in tile and
- Page 60 and 61: FLUORSPAR57with planned output of 1
- Page 62 and 63: GALLIUM59In response to the unprece
- Page 64 and 65: GARNET (INDUSTRIAL)61Events, Trends
- Page 68 and 69: GERMANIUM65Events, Trends, and Issu
- Page 70 and 71: GOLD67With the increase in price of
- Page 72 and 73: GRAPHITE (NATURAL)69Events, Trends,
- Page 74 and 75: GYPSUM71Through 2010, more than 3,6
- Page 76 and 77: HELIUM73Events, Trends, and Issues:
- Page 78 and 79: INDIUM75China’s 21 indium produce
- Page 80 and 81: IODINE77Events, Trends, and Issues:
- Page 82 and 83: IRON AND STEEL79Events, Trends, and
- Page 84 and 85: IRON AND STEEL SCRAP81Tariff: Item
- Page 86 and 87: IRON AND STEEL SLAG83Events, Trends
- Page 88 and 89: IRON ORE85In 2009, China imported a
- Page 90 and 91: IRON OXIDE PIGMENTS87Events, Trends
- Page 92 and 93: KYANITE AND RELATED MATERIALS89Even
- Page 94 and 95: LEAD91caused by underground fires a
- Page 96 and 97: LIME93The lime industry is facing p
- Page 98 and 99: LITHIUM95market, and a facility at
- Page 100 and 101: MAGNESIUM COMPOUNDS97In Australia,
- Page 102 and 103: MAGNESIUM METAL99U.S. magnesium con
- Page 104 and 105: MANGANESE101Government Stockpile:St
- Page 106 and 107: MERCURY103Events, Trends, and Issue
- Page 108 and 109: MICA (NATURAL)105Depletion Allowanc
- Page 110 and 111: MOLYBDENUM107Events, Trends, and Is
- Page 112 and 113: NICKEL109Nickel prices were adverse
- Page 114 and 115: NIOBIUM (COLUMBIUM)111Events, Trend
- Page 116 and 117:
NITROGEN (FIXED)—AMMONIA113Accord
- Page 118 and 119:
PEAT115Events, Trends, and Issues:
- Page 120 and 121:
PERLITE117Events, Trends, and Issue
- Page 122 and 123:
PHOSPHATE ROCK119Events, Trends, an
- Page 124 and 125:
PLATINUM-GROUP METALS121Events, Tre
- Page 126 and 127:
POTASH123Events, Trends, and Issues
- Page 128 and 129:
PUMICE AND PUMICITE125Events, Trend
- Page 130 and 131:
QUARTZ CRYSTAL (INDUSTRIAL)127Event
- Page 132 and 133:
RARE EARTHS129Events, Trends, and I
- Page 134 and 135:
RHENIUM131Events, Trends, and Issue
- Page 136 and 137:
RUBIDIUM133Events, Trends, and Issu
- Page 138 and 139:
SALT135Many chefs have advocated us
- Page 140 and 141:
SAND AND GRAVEL (CONSTRUCTION)137Ev
- Page 142 and 143:
SAND AND GRAVEL (INDUSTRIAL)139The
- Page 144 and 145:
SCANDIUM141Scandium’s use in meta
- Page 146 and 147:
SELENIUM143Events, Trends, and Issu
- Page 148 and 149:
SILICON145Events, Trends, and Issue
- Page 150 and 151:
SILVER147Silver was used as a repla
- Page 152 and 153:
SODA ASH149A Wyoming soda ash produ
- Page 154 and 155:
SODIUM SULFATE151Events, Trends, an
- Page 156 and 157:
STONE (CRUSHED)153Events, Trends, a
- Page 158 and 159:
STONE (DIMENSION)155Events, Trends,
- Page 160 and 161:
STRONTIUM157Events, Trends, and Iss
- Page 162 and 163:
SULFUR159World sulfur production in
- Page 164 and 165:
TALC AND PYROPHYLLITE161Events, Tre
- Page 166 and 167:
TANTALUM163Events, Trends, and Issu
- Page 168 and 169:
TELLURIUM165Events, Trends, and Iss
- Page 170:
THALLIUM167Beginning in 2009, there
- Page 173 and 174:
170TIN(Data in metric tons of tin c
- Page 175 and 176:
172TITANIUM AND TITANIUM DIOXIDE 1(
- Page 177 and 178:
174TITANIUM MINERAL CONCENTRATES 1(
- Page 179 and 180:
176TUNGSTEN(Data in metric tons of
- Page 181 and 182:
178VANADIUM(Data in metric tons of
- Page 183 and 184:
180VERMICULITE(Data in thousand met
- Page 185 and 186:
182WOLLASTONITE(Data in metric tons
- Page 187 and 188:
184YTTRIUM 1(Data in metric tons of
- Page 189 and 190:
186ZEOLITES (NATURAL)(Data in metri
- Page 191 and 192:
188ZINC(Data in thousand metric ton
- Page 193 and 194:
190ZIRCONIUM AND HAFNIUM(Data in me
- Page 195 and 196:
192APPENDIX AAbbreviations and Unit
- Page 197 and 198:
194Demonstrated.—A term for the s
- Page 199 and 200:
196Part B—Sources of Reserves Dat
- Page 201:
198Europe and Central Eurasia—con