KYANITE AND RELATED MATERIALS89Events, Trends, <strong>and</strong> Issues: Following the recession in 2008 <strong>and</strong> 2009, steel production in the United States, whichranked third in the world, rebounded with an increase of 56% in the first 8 months of 2010 compared with that of thesame period in 2009. (In the same period of 2009, steel production had declined by 49% from the first 8 months of2008.) Potentially increasing the dem<strong>and</strong> for kyanite-mullite, crude steel production in the other three of the world’sfour leading steel-producing countries also increased in the first 8 months of 2010 compared with that of the sameperiod in 2009—in China, the leading producer, by about 15%; in Japan (second) by 38%; <strong>and</strong> in Russia (fourth) by15%. Total world production rose by 22% during the same period. Of the total world refractories market, estimated tobe approximately 23 million tons, crude steel manufacturing consumed around 70% of production.Global dem<strong>and</strong> for refractory products grew significantly in the fourth quarter of 2009 <strong>and</strong> during 2010 as a result ofthe recovery of steel production <strong>and</strong> sharp reductions of refractory inventory implemented in 2009 across the supplychain. With the steel recovery continuing, mullite received increasing interest, as many refractory customers soughtalternative aluminosilicate refractory minerals to refractory bauxite. Industry sources in the United States, Europe, <strong>and</strong>Southeast Asia expressed concern regarding the supply of 60% Al 2 O 3 mullite grades from the United States. Such apotential shortage, along with the drive to reduce costs, resulted in a renewed interest in 60- <strong>and</strong> 70-grade mullitefrom China, although Chinese mullite prices were on the rise <strong>and</strong> the future availability there was uncertain. Becauseof increased dem<strong>and</strong>, one company restarted all its kilns at Andersonville, GA, in late 2009, <strong>and</strong> in early 2010,brought onstream a new kiln, adding 75,000 tons annually to the company’s existing production capacity.World Mine Production <strong>and</strong> Reserves:Mine production Reserves 32009 2010 eUnited States e 71 70 Large in the United States.France 65 65India 24 24South Africa 210 265Other countries 68World total (rounded) 375 430World Resources: Large resources of kyanite <strong>and</strong> related minerals are known to exist in the United States. The chiefresources are in deposits of micaceous schist <strong>and</strong> gneiss, mostly in the Appalachian Mountains area <strong>and</strong> in Idaho.Other resources are in aluminous gneiss in southern California. These resources are not economical to mine atpresent. The characteristics of kyanite resources in the rest of the world are thought to be similar to those in theUnited States.Substitutes: Two types of synthetic mullite (fused <strong>and</strong> sintered), superduty fire clays, <strong>and</strong> high-alumina materials aresubstitutes for kyanite in refractories. Principal raw materials for synthetic mullite are bauxite, kaolin <strong>and</strong> other clays,<strong>and</strong> silica s<strong>and</strong>.e Estimated. E Net exporter. NA Not available.1 Source: Industrial <strong>Mineral</strong>s.2 Defined as imports – exports + adjustments for Government <strong>and</strong> industry stock changes.3 See Appendix C for resource/reserve definitions <strong>and</strong> information concerning data sources.U.S. Geological Survey, <strong>Mineral</strong> <strong>Commodity</strong> <strong>Summaries</strong>, January <strong>2011</strong>
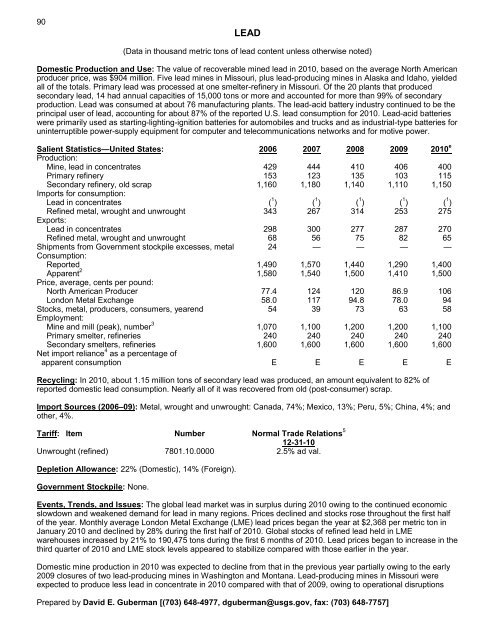
90LEAD(Data in thous<strong>and</strong> metric tons of lead content unless otherwise noted)Domestic Production <strong>and</strong> Use: The value of recoverable mined lead in 2010, based on the average North Americanproducer price, was $904 million. Five lead mines in Missouri, plus lead-producing mines in Alaska <strong>and</strong> Idaho, yieldedall of the totals. Primary lead was processed at one smelter-refinery in Missouri. Of the 20 plants that producedsecondary lead, 14 had annual capacities of 15,000 tons or more <strong>and</strong> accounted for more than 99% of secondaryproduction. Lead was consumed at about 76 manufacturing plants. The lead-acid battery industry continued to be theprincipal user of lead, accounting for about 87% of the reported U.S. lead consumption for 2010. Lead-acid batterieswere primarily used as starting-lighting-ignition batteries for automobiles <strong>and</strong> trucks <strong>and</strong> as industrial-type batteries foruninterruptible power-supply equipment for computer <strong>and</strong> telecommunications networks <strong>and</strong> for motive power.Salient Statistics—United States: 2006 2007 2008 2009 2010 eProduction:Mine, lead in concentrates 429 444 410 406 400Primary refinery 153 123 135 103 115Secondary refinery, old scrap 1,160 1,180 1,140 1,110 1,150Imports for consumption:Lead in concentrates ( 1 ) ( 1 ) ( 1 ) ( 1 ) ( 1 )Refined metal, wrought <strong>and</strong> unwrought 343 267 314 253 275Exports:Lead in concentrates 298 300 277 287 270Refined metal, wrought <strong>and</strong> unwrought 68 56 75 82 65Shipments from Government stockpile excesses, metal 24 — — — —Consumption:Reported 1,490 1,570 1,440 1,290 1,400Apparent 2 1,580 1,540 1,500 1,410 1,500Price, average, cents per pound:North American Producer 77.4 124 120 86.9 106London Metal Exchange 58.0 117 94.8 78.0 94Stocks, metal, producers, consumers, yearend 54 39 73 63 58Employment:Mine <strong>and</strong> mill (peak), number 3 1,070 1,100 1,200 1,200 1,100Primary smelter, refineries 240 240 240 240 240Secondary smelters, refineries 1,600 1,600 1,600 1,600 1,600Net import reliance 4 as a percentage ofapparent consumption E E E E ERecycling: In 2010, about 1.15 million tons of secondary lead was produced, an amount equivalent to 82% ofreported domestic lead consumption. Nearly all of it was recovered from old (post-consumer) scrap.Import Sources (2006–09): Metal, wrought <strong>and</strong> unwrought: Canada, 74%; Mexico, 13%; Peru, 5%; China, 4%; <strong>and</strong>other, 4%.Tariff: Item Number Normal Trade Relations 512-31-10Unwrought (refined) 7801.10.0000 2.5% ad val.Depletion Allowance: 22% (Domestic), 14% (Foreign).Government Stockpile: None.Events, Trends, <strong>and</strong> Issues: The global lead market was in surplus during 2010 owing to the continued economicslowdown <strong>and</strong> weakened dem<strong>and</strong> for lead in many regions. Prices declined <strong>and</strong> stocks rose throughout the first halfof the year. Monthly average London Metal Exchange (LME) lead prices began the year at $2,368 per metric ton inJanuary 2010 <strong>and</strong> declined by 28% during the first half of 2010. Global stocks of refined lead held in LMEwarehouses increased by 21% to 190,475 tons during the first 6 months of 2010. Lead prices began to increase in thethird quarter of 2010 <strong>and</strong> LME stock levels appeared to stabilize compared with those earlier in the year.Domestic mine production in 2010 was expected to decline from that in the previous year partially owing to the early2009 closures of two lead-producing mines in Washington <strong>and</strong> Montana. Lead-producing mines in Missouri wereexpected to produce less lead in concentrate in 2010 compared with that of 2009, owing to operational disruptionsPrepared by David E. Guberman [(703) 648-4977, dguberman@usgs.gov, fax: (703) 648-7757]
- Page 3:
U.S. Department of the InteriorKEN
- Page 6 and 7:
INTRODUCTION3Each chapter of the 20
- Page 8 and 9:
5NET EXPORTS OF MINERALRAW MATERIAL
- Page 10 and 11:
SIGNIFICANT EVENTS, TRENDS, AND ISS
- Page 12 and 13:
mineral materials valued at $1.30 b
- Page 14 and 15:
11MAJOR METAL-PRODUCING AREASAuB2P1
- Page 16 and 17:
13MAJOR INDUSTRIAL MINERAL-PRODUCIN
- Page 18 and 19:
ABRASIVES (MANUFACTURED)15Events, T
- Page 20 and 21:
ALUMINUM17The United States continu
- Page 22 and 23:
ANTIMONY19Events, Trends, and Issue
- Page 24 and 25:
ARSENIC21According to university me
- Page 26 and 27:
ASBESTOS23Events, Trends, and Issue
- Page 28 and 29:
BARITE25Nationally, the rig count o
- Page 30 and 31:
BAUXITE AND ALUMINA27Events, Trends
- Page 32 and 33:
BERYLLIUM29Events, Trends, and Issu
- Page 34 and 35:
BISMUTH31Events, Trends, and Issues
- Page 36 and 37:
BORON33Events, Trends, and Issues:
- Page 38 and 39:
BROMINE35Events, Trends, and Issues
- Page 40 and 41:
CADMIUM37NiCd battery use in consum
- Page 42 and 43: CEMENT39The manufacture of clinker
- Page 44 and 45: CESIUM41Events, Trends, and Issues:
- Page 46 and 47: CHROMIUM43Stockpile Status—9-30-1
- Page 48 and 49: CLAYS45Tariff: Item Number Normal T
- Page 50 and 51: COBALT47Events, Trends, and Issues:
- Page 52 and 53: COPPER49Events, Trends, and Issues:
- Page 54 and 55: DIAMOND (INDUSTRIAL)51Events, Trend
- Page 56 and 57: DIATOMITE53Events, Trends, and Issu
- Page 58 and 59: FELDSPAR55Feldspar use in tile and
- Page 60 and 61: FLUORSPAR57with planned output of 1
- Page 62 and 63: GALLIUM59In response to the unprece
- Page 64 and 65: GARNET (INDUSTRIAL)61Events, Trends
- Page 66 and 67: GEMSTONES63Events, Trends, and Issu
- Page 68 and 69: GERMANIUM65Events, Trends, and Issu
- Page 70 and 71: GOLD67With the increase in price of
- Page 72 and 73: GRAPHITE (NATURAL)69Events, Trends,
- Page 74 and 75: GYPSUM71Through 2010, more than 3,6
- Page 76 and 77: HELIUM73Events, Trends, and Issues:
- Page 78 and 79: INDIUM75China’s 21 indium produce
- Page 80 and 81: IODINE77Events, Trends, and Issues:
- Page 82 and 83: IRON AND STEEL79Events, Trends, and
- Page 84 and 85: IRON AND STEEL SCRAP81Tariff: Item
- Page 86 and 87: IRON AND STEEL SLAG83Events, Trends
- Page 88 and 89: IRON ORE85In 2009, China imported a
- Page 90 and 91: IRON OXIDE PIGMENTS87Events, Trends
- Page 94 and 95: LEAD91caused by underground fires a
- Page 96 and 97: LIME93The lime industry is facing p
- Page 98 and 99: LITHIUM95market, and a facility at
- Page 100 and 101: MAGNESIUM COMPOUNDS97In Australia,
- Page 102 and 103: MAGNESIUM METAL99U.S. magnesium con
- Page 104 and 105: MANGANESE101Government Stockpile:St
- Page 106 and 107: MERCURY103Events, Trends, and Issue
- Page 108 and 109: MICA (NATURAL)105Depletion Allowanc
- Page 110 and 111: MOLYBDENUM107Events, Trends, and Is
- Page 112 and 113: NICKEL109Nickel prices were adverse
- Page 114 and 115: NIOBIUM (COLUMBIUM)111Events, Trend
- Page 116 and 117: NITROGEN (FIXED)—AMMONIA113Accord
- Page 118 and 119: PEAT115Events, Trends, and Issues:
- Page 120 and 121: PERLITE117Events, Trends, and Issue
- Page 122 and 123: PHOSPHATE ROCK119Events, Trends, an
- Page 124 and 125: PLATINUM-GROUP METALS121Events, Tre
- Page 126 and 127: POTASH123Events, Trends, and Issues
- Page 128 and 129: PUMICE AND PUMICITE125Events, Trend
- Page 130 and 131: QUARTZ CRYSTAL (INDUSTRIAL)127Event
- Page 132 and 133: RARE EARTHS129Events, Trends, and I
- Page 134 and 135: RHENIUM131Events, Trends, and Issue
- Page 136 and 137: RUBIDIUM133Events, Trends, and Issu
- Page 138 and 139: SALT135Many chefs have advocated us
- Page 140 and 141: SAND AND GRAVEL (CONSTRUCTION)137Ev
- Page 142 and 143:
SAND AND GRAVEL (INDUSTRIAL)139The
- Page 144 and 145:
SCANDIUM141Scandium’s use in meta
- Page 146 and 147:
SELENIUM143Events, Trends, and Issu
- Page 148 and 149:
SILICON145Events, Trends, and Issue
- Page 150 and 151:
SILVER147Silver was used as a repla
- Page 152 and 153:
SODA ASH149A Wyoming soda ash produ
- Page 154 and 155:
SODIUM SULFATE151Events, Trends, an
- Page 156 and 157:
STONE (CRUSHED)153Events, Trends, a
- Page 158 and 159:
STONE (DIMENSION)155Events, Trends,
- Page 160 and 161:
STRONTIUM157Events, Trends, and Iss
- Page 162 and 163:
SULFUR159World sulfur production in
- Page 164 and 165:
TALC AND PYROPHYLLITE161Events, Tre
- Page 166 and 167:
TANTALUM163Events, Trends, and Issu
- Page 168 and 169:
TELLURIUM165Events, Trends, and Iss
- Page 170:
THALLIUM167Beginning in 2009, there
- Page 173 and 174:
170TIN(Data in metric tons of tin c
- Page 175 and 176:
172TITANIUM AND TITANIUM DIOXIDE 1(
- Page 177 and 178:
174TITANIUM MINERAL CONCENTRATES 1(
- Page 179 and 180:
176TUNGSTEN(Data in metric tons of
- Page 181 and 182:
178VANADIUM(Data in metric tons of
- Page 183 and 184:
180VERMICULITE(Data in thousand met
- Page 185 and 186:
182WOLLASTONITE(Data in metric tons
- Page 187 and 188:
184YTTRIUM 1(Data in metric tons of
- Page 189 and 190:
186ZEOLITES (NATURAL)(Data in metri
- Page 191 and 192:
188ZINC(Data in thousand metric ton
- Page 193 and 194:
190ZIRCONIUM AND HAFNIUM(Data in me
- Page 195 and 196:
192APPENDIX AAbbreviations and Unit
- Page 197 and 198:
194Demonstrated.—A term for the s
- Page 199 and 200:
196Part B—Sources of Reserves Dat
- Page 201:
198Europe and Central Eurasia—con