IRON AND STEEL SLAG83Events, Trends, <strong>and</strong> Issues: The availability of blast furnace slag has been in general decline in recent yearsbecause of the closure or idling of a number of U.S. blast furnaces, the lack of construction of new furnaces, <strong>and</strong> thedepletion of old slag piles. Granulation cooling is currently installed at only four active blast furnaces, but is beingevaluated for installation at other sites, contingent on the sites remaining active. Pelletized blast furnace slag remainsin limited supply, but it is unclear if any additional pelletizing capacity is being planned. Supplies of basic oxygenfurnace steel slag from integrated iron <strong>and</strong> steel works have become constrained as plants have been idled <strong>and</strong>because of an increasing volume of slag that is being returned to the furnaces. Slag from electric arc steel furnaces(largely fed with steel scrap) remains relatively abundant. Where slag availability has not been a problem, slag (asaggregate) sales into the construction sector have tended to be less volatile than those of natural aggregates or ofcement. Sales of granulated slag have trended more in line with those of cement, but, for both environmental <strong>and</strong>performance reasons, there has been a general growth in granulated slag’s share of the cementitious material marketin recent years, albeit still at a very small percentage of the total. Draft regulations were released in 2009–10 torestrict emissions (especially of mercury) by U.S. cement plants <strong>and</strong> to reclassify fly ash as a hazardous waste fordisposal purposes; both regulations have the potential to reduce the supply of these cementitious materials to theU.S. market <strong>and</strong>, if so, then sales <strong>and</strong> the market share of GGBFS would be expected to increase. Long-term growthin the supply of GGBFS is likely to hinge on imports, either of ground or unground material.World Mine Production <strong>and</strong> Reserves: Slag is not a mined material <strong>and</strong> thus the concept of reserves does notapply to this mineral commodity. Slag production data for the world are unavailable, but it is estimated that annualworld iron slag output in 2010 was on the order of 230 to 270 million tons, <strong>and</strong> steel slag about 120 to 180 milliontons, based on typical ratios of slag to crude iron <strong>and</strong> steel output.World Resources: Not applicable.Substitutes: Slag competes with crushed stone <strong>and</strong> s<strong>and</strong> <strong>and</strong> gravel as aggregates in the construction sector. Flyash, natural pozzolans, <strong>and</strong> silica fume are common alternatives to GGBFS as cementitious additives in blendedcements <strong>and</strong> concrete. Slags (especially steel slag) can be used as a partial substitute for limestone <strong>and</strong> some othernatural (rock) materials as raw material for clinker (cement) manufacture. Some other metallurgical slags, such ascopper slag, can compete with ferrous slags for some specialty markets, but are generally in much more restrictedsupply than ferrous slags.e Estimated. NA Not available.1 The data (obtained from an annual survey of slag processors) pertain to the quantities of processed slag sold rather than that processed orproduced during the year. The data exclude any entrained metal that may be recovered during slag processing <strong>and</strong> returned to iron <strong>and</strong>, especially,steel furnaces, <strong>and</strong> are incomplete regarding slag returns to the furnaces.2 There were very minor sales of open hearth furnace steel slag from stockpiles but no domestic production of this slag type in 2006–10.3 Data include sales of imported granulated blast furnace slag, either after domestic grinding or still unground, <strong>and</strong> exclude sales of pelletized slag(proprietary but very small). Overall, actual production of blast furnace slag may be estimated as equivalent to 25% to 30% of crude (pig) ironproduction <strong>and</strong> steel furnace slag as about 10% to 15% of crude steel output.4 Comparison of official (U.S. Census Bureau) with unofficial import data suggest that the official data significantly understate the true imports ofgranulated slag. The USGS canvass appears to capture only part of the imported slag. Thus the apparent consumption statistics are likely too lowby about 0.3 to 1.3 million tons per year.5 Less than ½ unit.6 Defined as total sales of slag (includes that from imported feed) minus exports. Calculation is based on unrounded original data.7 Defined as total sales of imported slag minus exports of slag. Data are not available to allow adjustments for changes in stocks.U.S. Geological Survey, <strong>Mineral</strong> <strong>Commodity</strong> <strong>Summaries</strong>, January <strong>2011</strong>
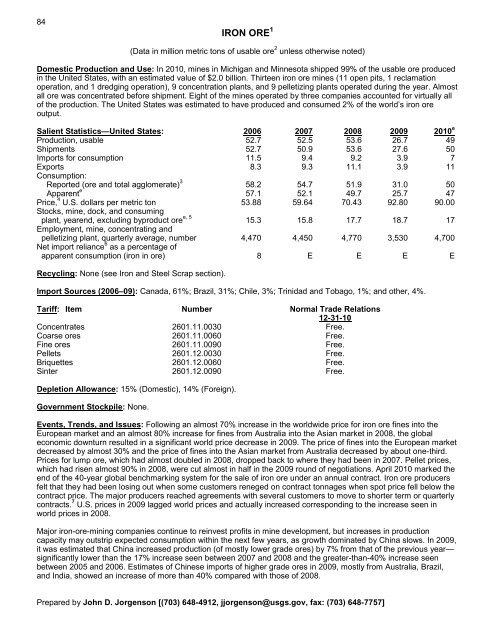
84IRON ORE 1(Data in million metric tons of usable ore 2 unless otherwise noted)Domestic Production <strong>and</strong> Use: In 2010, mines in Michigan <strong>and</strong> Minnesota shipped 99% of the usable ore producedin the United States, with an estimated value of $2.0 billion. Thirteen iron ore mines (11 open pits, 1 reclamationoperation, <strong>and</strong> 1 dredging operation), 9 concentration plants, <strong>and</strong> 9 pelletizing plants operated during the year. Almostall ore was concentrated before shipment. Eight of the mines operated by three companies accounted for virtually allof the production. The United States was estimated to have produced <strong>and</strong> consumed 2% of the world’s iron oreoutput.Salient Statistics—United States: 2006 2007 2008 2009 2010 eProduction, usable 52.7 52.5 53.6 26.7 49Shipments 52.7 50.9 53.6 27.6 50Imports for consumption 11.5 9.4 9.2 3.9 7Exports 8.3 9.3 11.1 3.9 11Consumption:Reported (ore <strong>and</strong> total agglomerate) 3 58.2 54.7 51.9 31.0 50Apparent e 57.1 52.1 49.7 25.7 47Price, 4 U.S. dollars per metric ton 53.88 59.64 70.43 92.80 90.00Stocks, mine, dock, <strong>and</strong> consumingplant, yearend, excluding byproduct ore e, 5 15.3 15.8 17.7 18.7 17Employment, mine, concentrating <strong>and</strong>pelletizing plant, quarterly average, number 4,470 4,450 4,770 3,530 4,700Net import reliance 6 as a percentage ofapparent consumption (iron in ore) 8 E E E ERecycling: None (see Iron <strong>and</strong> Steel Scrap section).Import Sources (2006–09): Canada, 61%; Brazil, 31%; Chile, 3%; Trinidad <strong>and</strong> Tobago, 1%; <strong>and</strong> other, 4%.Tariff: Item Number Normal Trade Relations12-31-10Concentrates 2601.11.0030 Free.Coarse ores 2601.11.0060 Free.Fine ores 2601.11.0090 Free.Pellets 2601.12.0030 Free.Briquettes 2601.12.0060 Free.Sinter 2601.12.0090 Free.Depletion Allowance: 15% (Domestic), 14% (Foreign).Government Stockpile: None.Events, Trends, <strong>and</strong> Issues: Following an almost 70% increase in the worldwide price for iron ore fines into theEuropean market <strong>and</strong> an almost 80% increase for fines from Australia into the Asian market in 2008, the globaleconomic downturn resulted in a significant world price decrease in 2009. The price of fines into the European marketdecreased by almost 30% <strong>and</strong> the price of fines into the Asian market from Australia decreased by about one-third.Prices for lump ore, which had almost doubled in 2008, dropped back to where they had been in 2007. Pellet prices,which had risen almost 90% in 2008, were cut almost in half in the 2009 round of negotiations. April 2010 marked theend of the 40-year global benchmarking system for the sale of iron ore under an annual contract. Iron ore producersfelt that they had been losing out when some customers reneged on contract tonnages when spot price fell below thecontract price. The major producers reached agreements with several customers to move to shorter term or quarterlycontracts. 7 U.S. prices in 2009 lagged world prices <strong>and</strong> actually increased corresponding to the increase seen inworld prices in 2008.Major iron-ore-mining companies continue to reinvest profits in mine development, but increases in productioncapacity may outstrip expected consumption within the next few years, as growth dominated by China slows. In 2009,it was estimated that China increased production (of mostly lower grade ores) by 7% from that of the previous year—significantly lower than the 17% increase seen between 2007 <strong>and</strong> 2008 <strong>and</strong> the greater-than-40% increase seenbetween 2005 <strong>and</strong> 2006. Estimates of Chinese imports of higher grade ores in 2009, mostly from Australia, Brazil,<strong>and</strong> India, showed an increase of more than 40% compared with those of 2008.Prepared by John D. Jorgenson [(703) 648-4912, jjorgenson@usgs.gov, fax: (703) 648-7757]
- Page 3:
U.S. Department of the InteriorKEN
- Page 6 and 7:
INTRODUCTION3Each chapter of the 20
- Page 8 and 9:
5NET EXPORTS OF MINERALRAW MATERIAL
- Page 10 and 11:
SIGNIFICANT EVENTS, TRENDS, AND ISS
- Page 12 and 13:
mineral materials valued at $1.30 b
- Page 14 and 15:
11MAJOR METAL-PRODUCING AREASAuB2P1
- Page 16 and 17:
13MAJOR INDUSTRIAL MINERAL-PRODUCIN
- Page 18 and 19:
ABRASIVES (MANUFACTURED)15Events, T
- Page 20 and 21:
ALUMINUM17The United States continu
- Page 22 and 23:
ANTIMONY19Events, Trends, and Issue
- Page 24 and 25:
ARSENIC21According to university me
- Page 26 and 27:
ASBESTOS23Events, Trends, and Issue
- Page 28 and 29:
BARITE25Nationally, the rig count o
- Page 30 and 31:
BAUXITE AND ALUMINA27Events, Trends
- Page 32 and 33:
BERYLLIUM29Events, Trends, and Issu
- Page 34 and 35:
BISMUTH31Events, Trends, and Issues
- Page 36 and 37: BORON33Events, Trends, and Issues:
- Page 38 and 39: BROMINE35Events, Trends, and Issues
- Page 40 and 41: CADMIUM37NiCd battery use in consum
- Page 42 and 43: CEMENT39The manufacture of clinker
- Page 44 and 45: CESIUM41Events, Trends, and Issues:
- Page 46 and 47: CHROMIUM43Stockpile Status—9-30-1
- Page 48 and 49: CLAYS45Tariff: Item Number Normal T
- Page 50 and 51: COBALT47Events, Trends, and Issues:
- Page 52 and 53: COPPER49Events, Trends, and Issues:
- Page 54 and 55: DIAMOND (INDUSTRIAL)51Events, Trend
- Page 56 and 57: DIATOMITE53Events, Trends, and Issu
- Page 58 and 59: FELDSPAR55Feldspar use in tile and
- Page 60 and 61: FLUORSPAR57with planned output of 1
- Page 62 and 63: GALLIUM59In response to the unprece
- Page 64 and 65: GARNET (INDUSTRIAL)61Events, Trends
- Page 66 and 67: GEMSTONES63Events, Trends, and Issu
- Page 68 and 69: GERMANIUM65Events, Trends, and Issu
- Page 70 and 71: GOLD67With the increase in price of
- Page 72 and 73: GRAPHITE (NATURAL)69Events, Trends,
- Page 74 and 75: GYPSUM71Through 2010, more than 3,6
- Page 76 and 77: HELIUM73Events, Trends, and Issues:
- Page 78 and 79: INDIUM75China’s 21 indium produce
- Page 80 and 81: IODINE77Events, Trends, and Issues:
- Page 82 and 83: IRON AND STEEL79Events, Trends, and
- Page 84 and 85: IRON AND STEEL SCRAP81Tariff: Item
- Page 88 and 89: IRON ORE85In 2009, China imported a
- Page 90 and 91: IRON OXIDE PIGMENTS87Events, Trends
- Page 92 and 93: KYANITE AND RELATED MATERIALS89Even
- Page 94 and 95: LEAD91caused by underground fires a
- Page 96 and 97: LIME93The lime industry is facing p
- Page 98 and 99: LITHIUM95market, and a facility at
- Page 100 and 101: MAGNESIUM COMPOUNDS97In Australia,
- Page 102 and 103: MAGNESIUM METAL99U.S. magnesium con
- Page 104 and 105: MANGANESE101Government Stockpile:St
- Page 106 and 107: MERCURY103Events, Trends, and Issue
- Page 108 and 109: MICA (NATURAL)105Depletion Allowanc
- Page 110 and 111: MOLYBDENUM107Events, Trends, and Is
- Page 112 and 113: NICKEL109Nickel prices were adverse
- Page 114 and 115: NIOBIUM (COLUMBIUM)111Events, Trend
- Page 116 and 117: NITROGEN (FIXED)—AMMONIA113Accord
- Page 118 and 119: PEAT115Events, Trends, and Issues:
- Page 120 and 121: PERLITE117Events, Trends, and Issue
- Page 122 and 123: PHOSPHATE ROCK119Events, Trends, an
- Page 124 and 125: PLATINUM-GROUP METALS121Events, Tre
- Page 126 and 127: POTASH123Events, Trends, and Issues
- Page 128 and 129: PUMICE AND PUMICITE125Events, Trend
- Page 130 and 131: QUARTZ CRYSTAL (INDUSTRIAL)127Event
- Page 132 and 133: RARE EARTHS129Events, Trends, and I
- Page 134 and 135: RHENIUM131Events, Trends, and Issue
- Page 136 and 137:
RUBIDIUM133Events, Trends, and Issu
- Page 138 and 139:
SALT135Many chefs have advocated us
- Page 140 and 141:
SAND AND GRAVEL (CONSTRUCTION)137Ev
- Page 142 and 143:
SAND AND GRAVEL (INDUSTRIAL)139The
- Page 144 and 145:
SCANDIUM141Scandium’s use in meta
- Page 146 and 147:
SELENIUM143Events, Trends, and Issu
- Page 148 and 149:
SILICON145Events, Trends, and Issue
- Page 150 and 151:
SILVER147Silver was used as a repla
- Page 152 and 153:
SODA ASH149A Wyoming soda ash produ
- Page 154 and 155:
SODIUM SULFATE151Events, Trends, an
- Page 156 and 157:
STONE (CRUSHED)153Events, Trends, a
- Page 158 and 159:
STONE (DIMENSION)155Events, Trends,
- Page 160 and 161:
STRONTIUM157Events, Trends, and Iss
- Page 162 and 163:
SULFUR159World sulfur production in
- Page 164 and 165:
TALC AND PYROPHYLLITE161Events, Tre
- Page 166 and 167:
TANTALUM163Events, Trends, and Issu
- Page 168 and 169:
TELLURIUM165Events, Trends, and Iss
- Page 170:
THALLIUM167Beginning in 2009, there
- Page 173 and 174:
170TIN(Data in metric tons of tin c
- Page 175 and 176:
172TITANIUM AND TITANIUM DIOXIDE 1(
- Page 177 and 178:
174TITANIUM MINERAL CONCENTRATES 1(
- Page 179 and 180:
176TUNGSTEN(Data in metric tons of
- Page 181 and 182:
178VANADIUM(Data in metric tons of
- Page 183 and 184:
180VERMICULITE(Data in thousand met
- Page 185 and 186:
182WOLLASTONITE(Data in metric tons
- Page 187 and 188:
184YTTRIUM 1(Data in metric tons of
- Page 189 and 190:
186ZEOLITES (NATURAL)(Data in metri
- Page 191 and 192:
188ZINC(Data in thousand metric ton
- Page 193 and 194:
190ZIRCONIUM AND HAFNIUM(Data in me
- Page 195 and 196:
192APPENDIX AAbbreviations and Unit
- Page 197 and 198:
194Demonstrated.—A term for the s
- Page 199 and 200:
196Part B—Sources of Reserves Dat
- Page 201:
198Europe and Central Eurasia—con


