INDIUM75China’s 21 indium producers were allowed to export a combined total of 93 tons of indium in the latter half of 2010,compared with 140 tons during the first half of the year. Most of this material was exported to Japan for consumption.In the downstream market, dem<strong>and</strong> for ITO targets increased during the first half of 2010 from that of the second halfof 2009 owing to a rise in LCD panel production. However, LCD panel inventories began to increase during thesecond half of 2010 owing to lower-than-expected LCD sales in the United States <strong>and</strong> global economic uncertainty.One LCD panel producer initiated a 30% production cut at one of its Japanese plants to control inventory. As a resultof weakening LCD dem<strong>and</strong> that occurred in the latter half of 2010, LCD panel producers lowered prices, resulting inan aggressive price competition among flat-screen LCD TV producers. However, ITO producers were not able tosignificantly lower their prices as higher indium prices in 2010 cut into profits.World Refinery Production <strong>and</strong> Reserves:Refinery production Reserves 62009 2010 eUnited States — — Quantitative estimates of reserves are notBelgium 30 30 available.Brazil 5 5Canada 40 35China 280 300Japan 67 70Korea, Republic of 70 80Peru 25 25Russia 4 4Other countries 2525World total (rounded) 546 574World Resources: Indium’s abundance in the continental crust is estimated to be approximately 0.05 part per million.Trace amounts of indium occur in base metal sulfides—particularly chalcopyrite, sphalerite, <strong>and</strong> stannite—by ionicsubstitution. Indium is most commonly recovered from the zinc-sulfide ore mineral sphalerite. The average indiumcontent of zinc deposits from which it is recovered ranges from less than 1 part per million to 100 parts per million.Although the geochemical properties of indium are such that it occurs with other base metals—copper, lead, <strong>and</strong> tin—<strong>and</strong> to a lesser extent with bismuth, cadmium, <strong>and</strong> silver, most deposits of these metals are subeconomic for indium.Vein stockwork deposits of tin <strong>and</strong> tungsten host the highest known concentrations of indium. However, the indiumfrom this type of deposit is usually difficult to process economically. Other major geologic hosts for indiummineralization include volcanic-hosted massive sulfide deposits, sediment-hosted exhalative massive sulfide deposits,polymetallic vein-type deposits, epithermal deposits, active magmatic systems, porphyry copper deposits, <strong>and</strong> skarndeposits.Substitutes: Indium’s recent price volatility <strong>and</strong> various supply concerns associated with the metal have acceleratedthe development of ITO substitutes. Antimony tin oxide coatings, which are deposited by an ink-jetting process, havebeen developed as an alternative to ITO coatings in LCDs <strong>and</strong> have been successfully annealed to LCD glass.Carbon nanotube coatings, applied by wet-processing techniques, have been developed as an alternative to ITOcoatings in flexible displays, solar cells, <strong>and</strong> touch screens. Poly(3,4-ethylene dioxythiophene) (PEDOT) has alsobeen developed as a substitute for ITO in flexible displays <strong>and</strong> organic light-emitting diodes. PEDOT can be applied ina variety of ways, including spin coating, dip coating, <strong>and</strong> printing techniques. Graphene quantum dots have beendeveloped to replace ITO electrodes in solar cells <strong>and</strong> also have been explored as a replacement for ITO in LCDs.Researchers have recently developed a more adhesive zinc oxide nanopowder to replace ITO in LCDs. Thetechnology was estimated to be commercially available within the next 3 years. Gallium arsenide can substitute forindium phosphide in solar cells <strong>and</strong> in many semiconductor applications. Hafnium can replace indium in nuclearreactor control rod alloys.e Estimated. NA Not available. — Zero.1 Imports for consumption of unwrought indium <strong>and</strong> indium powders (Tariff no. 8112.92.3000).2 Indium Corp.’s price for 99.97% purity metal; 1-kilogram bar in lots of 10,000 troy ounces. Source: Platts Metals Week.3 Price is based on 99.99% minimum purity indium at warehouse (Rotterdam); cost, insurance, <strong>and</strong> freight (in minimum lots of 50 kilograms).Source: Platts Metals Week.4 Price is based on 99.99% purity indium, primary or secondary, shipped to Japan. Source: Platts Metals Week.5 Defined as imports – exports + adjustments for Government <strong>and</strong> industry stock changes; exports were assumed to be no greater than thedifference between imports <strong>and</strong> consumption.6 See Appendix C for resource/reserve definitions <strong>and</strong> information concerning data sources.U.S. Geological Survey, <strong>Mineral</strong> <strong>Commodity</strong> <strong>Summaries</strong>, January <strong>2011</strong>
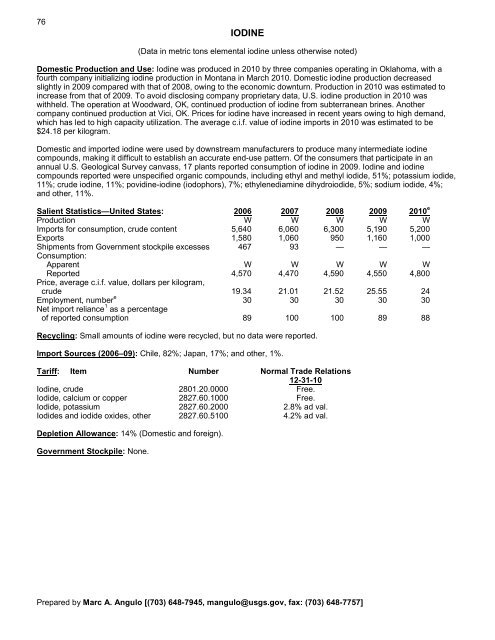
76IODINE(Data in metric tons elemental iodine unless otherwise noted)Domestic Production <strong>and</strong> Use: Iodine was produced in 2010 by three companies operating in Oklahoma, with afourth company initializing iodine production in Montana in March 2010. Domestic iodine production decreasedslightly in 2009 compared with that of 2008, owing to the economic downturn. Production in 2010 was estimated toincrease from that of 2009. To avoid disclosing company proprietary data, U.S. iodine production in 2010 waswithheld. The operation at Woodward, OK, continued production of iodine from subterranean brines. Anothercompany continued production at Vici, OK. Prices for iodine have increased in recent years owing to high dem<strong>and</strong>,which has led to high capacity utilization. The average c.i.f. value of iodine imports in 2010 was estimated to be$24.18 per kilogram.Domestic <strong>and</strong> imported iodine were used by downstream manufacturers to produce many intermediate iodinecompounds, making it difficult to establish an accurate end-use pattern. Of the consumers that participate in anannual U.S. Geological Survey canvass, 17 plants reported consumption of iodine in 2009. Iodine <strong>and</strong> iodinecompounds reported were unspecified organic compounds, including ethyl <strong>and</strong> methyl iodide, 51%; potassium iodide,11%; crude iodine, 11%; povidine-iodine (iodophors), 7%; ethylenediamine dihydroiodide, 5%; sodium iodide, 4%;<strong>and</strong> other, 11%.Salient Statistics—United States: 2006 2007 2008 2009 2010 eProduction W W W W WImports for consumption, crude content 5,640 6,060 6,300 5,190 5,200Exports 1,580 1,060 950 1,160 1,000Shipments from Government stockpile excesses 467 93 — — —Consumption:Apparent W W W W WReported 4,570 4,470 4,590 4,550 4,800Price, average c.i.f. value, dollars per kilogram,crude 19.34 21.01 21.52 25.55 24Employment, number e 30 30 30 30 30Net import reliance 1 as a percentageof reported consumption 89 100 100 89 88Recycling: Small amounts of iodine were recycled, but no data were reported.Import Sources (2006–09): Chile, 82%; Japan, 17%; <strong>and</strong> other, 1%.Tariff: Item Number Normal Trade Relations12-31-10Iodine, crude 2801.20.0000 Free.Iodide, calcium or copper 2827.60.1000 Free.Iodide, potassium 2827.60.2000 2.8% ad val.Iodides <strong>and</strong> iodide oxides, other 2827.60.5100 4.2% ad val.Depletion Allowance: 14% (Domestic <strong>and</strong> foreign).Government Stockpile: None.Prepared by Marc A. Angulo [(703) 648-7945, mangulo@usgs.gov, fax: (703) 648-7757]
- Page 3:
U.S. Department of the InteriorKEN
- Page 6 and 7:
INTRODUCTION3Each chapter of the 20
- Page 8 and 9:
5NET EXPORTS OF MINERALRAW MATERIAL
- Page 10 and 11:
SIGNIFICANT EVENTS, TRENDS, AND ISS
- Page 12 and 13:
mineral materials valued at $1.30 b
- Page 14 and 15:
11MAJOR METAL-PRODUCING AREASAuB2P1
- Page 16 and 17:
13MAJOR INDUSTRIAL MINERAL-PRODUCIN
- Page 18 and 19:
ABRASIVES (MANUFACTURED)15Events, T
- Page 20 and 21:
ALUMINUM17The United States continu
- Page 22 and 23:
ANTIMONY19Events, Trends, and Issue
- Page 24 and 25:
ARSENIC21According to university me
- Page 26 and 27:
ASBESTOS23Events, Trends, and Issue
- Page 28 and 29: BARITE25Nationally, the rig count o
- Page 30 and 31: BAUXITE AND ALUMINA27Events, Trends
- Page 32 and 33: BERYLLIUM29Events, Trends, and Issu
- Page 34 and 35: BISMUTH31Events, Trends, and Issues
- Page 36 and 37: BORON33Events, Trends, and Issues:
- Page 38 and 39: BROMINE35Events, Trends, and Issues
- Page 40 and 41: CADMIUM37NiCd battery use in consum
- Page 42 and 43: CEMENT39The manufacture of clinker
- Page 44 and 45: CESIUM41Events, Trends, and Issues:
- Page 46 and 47: CHROMIUM43Stockpile Status—9-30-1
- Page 48 and 49: CLAYS45Tariff: Item Number Normal T
- Page 50 and 51: COBALT47Events, Trends, and Issues:
- Page 52 and 53: COPPER49Events, Trends, and Issues:
- Page 54 and 55: DIAMOND (INDUSTRIAL)51Events, Trend
- Page 56 and 57: DIATOMITE53Events, Trends, and Issu
- Page 58 and 59: FELDSPAR55Feldspar use in tile and
- Page 60 and 61: FLUORSPAR57with planned output of 1
- Page 62 and 63: GALLIUM59In response to the unprece
- Page 64 and 65: GARNET (INDUSTRIAL)61Events, Trends
- Page 66 and 67: GEMSTONES63Events, Trends, and Issu
- Page 68 and 69: GERMANIUM65Events, Trends, and Issu
- Page 70 and 71: GOLD67With the increase in price of
- Page 72 and 73: GRAPHITE (NATURAL)69Events, Trends,
- Page 74 and 75: GYPSUM71Through 2010, more than 3,6
- Page 76 and 77: HELIUM73Events, Trends, and Issues:
- Page 80 and 81: IODINE77Events, Trends, and Issues:
- Page 82 and 83: IRON AND STEEL79Events, Trends, and
- Page 84 and 85: IRON AND STEEL SCRAP81Tariff: Item
- Page 86 and 87: IRON AND STEEL SLAG83Events, Trends
- Page 88 and 89: IRON ORE85In 2009, China imported a
- Page 90 and 91: IRON OXIDE PIGMENTS87Events, Trends
- Page 92 and 93: KYANITE AND RELATED MATERIALS89Even
- Page 94 and 95: LEAD91caused by underground fires a
- Page 96 and 97: LIME93The lime industry is facing p
- Page 98 and 99: LITHIUM95market, and a facility at
- Page 100 and 101: MAGNESIUM COMPOUNDS97In Australia,
- Page 102 and 103: MAGNESIUM METAL99U.S. magnesium con
- Page 104 and 105: MANGANESE101Government Stockpile:St
- Page 106 and 107: MERCURY103Events, Trends, and Issue
- Page 108 and 109: MICA (NATURAL)105Depletion Allowanc
- Page 110 and 111: MOLYBDENUM107Events, Trends, and Is
- Page 112 and 113: NICKEL109Nickel prices were adverse
- Page 114 and 115: NIOBIUM (COLUMBIUM)111Events, Trend
- Page 116 and 117: NITROGEN (FIXED)—AMMONIA113Accord
- Page 118 and 119: PEAT115Events, Trends, and Issues:
- Page 120 and 121: PERLITE117Events, Trends, and Issue
- Page 122 and 123: PHOSPHATE ROCK119Events, Trends, an
- Page 124 and 125: PLATINUM-GROUP METALS121Events, Tre
- Page 126 and 127: POTASH123Events, Trends, and Issues
- Page 128 and 129:
PUMICE AND PUMICITE125Events, Trend
- Page 130 and 131:
QUARTZ CRYSTAL (INDUSTRIAL)127Event
- Page 132 and 133:
RARE EARTHS129Events, Trends, and I
- Page 134 and 135:
RHENIUM131Events, Trends, and Issue
- Page 136 and 137:
RUBIDIUM133Events, Trends, and Issu
- Page 138 and 139:
SALT135Many chefs have advocated us
- Page 140 and 141:
SAND AND GRAVEL (CONSTRUCTION)137Ev
- Page 142 and 143:
SAND AND GRAVEL (INDUSTRIAL)139The
- Page 144 and 145:
SCANDIUM141Scandium’s use in meta
- Page 146 and 147:
SELENIUM143Events, Trends, and Issu
- Page 148 and 149:
SILICON145Events, Trends, and Issue
- Page 150 and 151:
SILVER147Silver was used as a repla
- Page 152 and 153:
SODA ASH149A Wyoming soda ash produ
- Page 154 and 155:
SODIUM SULFATE151Events, Trends, an
- Page 156 and 157:
STONE (CRUSHED)153Events, Trends, a
- Page 158 and 159:
STONE (DIMENSION)155Events, Trends,
- Page 160 and 161:
STRONTIUM157Events, Trends, and Iss
- Page 162 and 163:
SULFUR159World sulfur production in
- Page 164 and 165:
TALC AND PYROPHYLLITE161Events, Tre
- Page 166 and 167:
TANTALUM163Events, Trends, and Issu
- Page 168 and 169:
TELLURIUM165Events, Trends, and Iss
- Page 170:
THALLIUM167Beginning in 2009, there
- Page 173 and 174:
170TIN(Data in metric tons of tin c
- Page 175 and 176:
172TITANIUM AND TITANIUM DIOXIDE 1(
- Page 177 and 178:
174TITANIUM MINERAL CONCENTRATES 1(
- Page 179 and 180:
176TUNGSTEN(Data in metric tons of
- Page 181 and 182:
178VANADIUM(Data in metric tons of
- Page 183 and 184:
180VERMICULITE(Data in thousand met
- Page 185 and 186:
182WOLLASTONITE(Data in metric tons
- Page 187 and 188:
184YTTRIUM 1(Data in metric tons of
- Page 189 and 190:
186ZEOLITES (NATURAL)(Data in metri
- Page 191 and 192:
188ZINC(Data in thousand metric ton
- Page 193 and 194:
190ZIRCONIUM AND HAFNIUM(Data in me
- Page 195 and 196:
192APPENDIX AAbbreviations and Unit
- Page 197 and 198:
194Demonstrated.—A term for the s
- Page 199 and 200:
196Part B—Sources of Reserves Dat
- Page 201:
198Europe and Central Eurasia—con