NITROGEN (FIXED)—AMMONIA113According to the U.S. Department of Agriculture, U.S. corn growers planted 35.6 million hectares of corn in the 2010crop year (July 1, 2009, through June 30, 2010), which was 2% higher than the area planted in 2009. Favorableplanting conditions occurred through early May, but below average temperatures <strong>and</strong> wet conditions dominated muchof the Midwest <strong>and</strong> portions of the Plains in the middle part of May, hampering the planting of the remaining acreage.Corn plantings for the <strong>2011</strong> crop year, however, were expected to increase to 36.0 million hectares. Corn acreagewas expected to remain high owing in part to continued U.S. ethanol production <strong>and</strong> U.S. corn exports in response toa strong global dem<strong>and</strong> for feed grains.Nitrogen compounds also were an environmental concern. Overfertilization <strong>and</strong> the subsequent runoff of excessfertilizer may contribute to nitrogen accumulation in watersheds. Nitrogen in excess fertilizer runoff was suspected tobe a cause of the hypoxic zone that arises in the Gulf of Mexico during the summer. Scientists continued to study theeffects of fertilization on the Nation’s environmental health.World Ammonia Production <strong>and</strong> Reserves:Plant production Reserves 52009 2010 eUnited States 7,700 8,300 Available atmospheric nitrogen <strong>and</strong> sourcesAustralia 1,200 1,200 of natural gas for production of ammoniaBangladesh 1,300 1,300 are considered adequate for all listedCanada 4,000 4,000 countries.China 42,300 42,000Egypt 2,000 2,300Germany 2,360 2,500India 11,200 11,700Indonesia 4,600 4,600Iran 2,000 2,000Japan 1,100 1,000Netherl<strong>and</strong>s 1,800 1,800Pakistan 2,300 2,300Pol<strong>and</strong> 1,990 1,900Qatar 1,800 1,800Romania 1,300 1,300Russia 10,400 10,400Saudi Arabia 2,600 2,600Trinidad <strong>and</strong> Tobago 5,100 5,500Ukraine 4,200 3,300Uzbekistan 1,000 1,000Venezuela 1,160 1,160Other countries 17,000 17,000World total (rounded) 130,000 131,000World Resources: The availability of nitrogen from the atmosphere for fixed nitrogen production is unlimited.<strong>Mineral</strong>ized occurrences of sodium <strong>and</strong> potassium nitrates, found in the Atacama Desert of Chile, contribute minimallyto global nitrogen supply.Substitutes: Nitrogen is an essential plant nutrient that has no substitute. Also, there are no known practicalsubstitutes for nitrogen explosives <strong>and</strong> blasting agents.e Estimated.1 U.S. Department of Commerce (DOC) data unless otherwise noted.2 Annual <strong>and</strong> preliminary data as reported in Current Industrial Reports MQ325B (DOC).3 Source: Green Markets.4 Defined as imports – exports + adjustments for Government <strong>and</strong> industry stock changes.5 See Appendix C for resource/reserve definitions <strong>and</strong> information concerning data sources.U.S. Geological Survey, <strong>Mineral</strong> <strong>Commodity</strong> <strong>Summaries</strong>, January <strong>2011</strong>
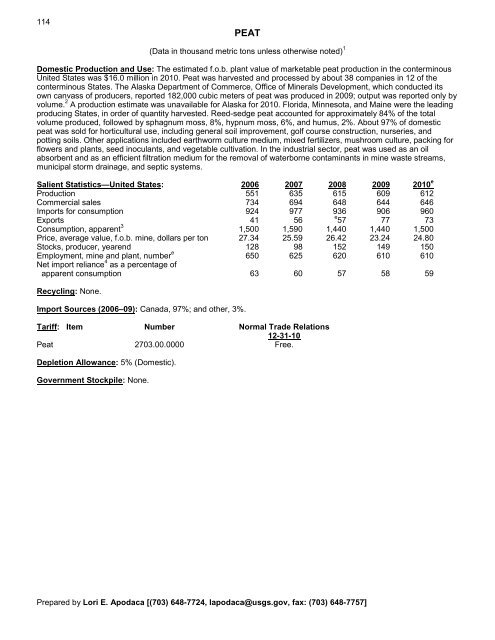
114PEAT(Data in thous<strong>and</strong> metric tons unless otherwise noted) 1Domestic Production <strong>and</strong> Use: The estimated f.o.b. plant value of marketable peat production in the conterminousUnited States was $16.0 million in 2010. Peat was harvested <strong>and</strong> processed by about 38 companies in 12 of theconterminous States. The Alaska Department of Commerce, Office of <strong>Mineral</strong>s Development, which conducted itsown canvass of producers, reported 182,000 cubic meters of peat was produced in 2009; output was reported only byvolume. 2 A production estimate was unavailable for Alaska for 2010. Florida, Minnesota, <strong>and</strong> Maine were the leadingproducing States, in order of quantity harvested. Reed-sedge peat accounted for approximately 84% of the totalvolume produced, followed by sphagnum moss, 8%, hypnum moss, 6%, <strong>and</strong> humus, 2%. About 97% of domesticpeat was sold for horticultural use, including general soil improvement, golf course construction, nurseries, <strong>and</strong>potting soils. Other applications included earthworm culture medium, mixed fertilizers, mushroom culture, packing forflowers <strong>and</strong> plants, seed inoculants, <strong>and</strong> vegetable cultivation. In the industrial sector, peat was used as an oilabsorbent <strong>and</strong> as an efficient filtration medium for the removal of waterborne contaminants in mine waste streams,municipal storm drainage, <strong>and</strong> septic systems.Salient Statistics—United States: 2006 2007 2008 2009 2010 eProduction 551 635 615 609 612Commercial sales 734 694 648 644 646Imports for consumption 924 977 936 906 960Exports 41 5657 77 73Consumption, apparent 3 1,500 1,590 1,440 1,440 1,500Price, average value, f.o.b. mine, dollars per ton 27.34 25.59 26.42 23.24 24.80Stocks, producer, yearend 128 98 152 149 150Employment, mine <strong>and</strong> plant, number e 650 625 620 610 610Net import reliance 4 as a percentage ofapparent consumption 63 60 57 58 59Recycling: None.Import Sources (2006–09): Canada, 97%; <strong>and</strong> other, 3%.Tariff: Item Number Normal Trade Relations12-31-10Peat 2703.00.0000 Free.Depletion Allowance: 5% (Domestic).Government Stockpile: None.Prepared by Lori E. Apodaca [(703) 648-7724, lapodaca@usgs.gov, fax: (703) 648-7757]
- Page 3:
U.S. Department of the InteriorKEN
- Page 6 and 7:
INTRODUCTION3Each chapter of the 20
- Page 8 and 9:
5NET EXPORTS OF MINERALRAW MATERIAL
- Page 10 and 11:
SIGNIFICANT EVENTS, TRENDS, AND ISS
- Page 12 and 13:
mineral materials valued at $1.30 b
- Page 14 and 15:
11MAJOR METAL-PRODUCING AREASAuB2P1
- Page 16 and 17:
13MAJOR INDUSTRIAL MINERAL-PRODUCIN
- Page 18 and 19:
ABRASIVES (MANUFACTURED)15Events, T
- Page 20 and 21:
ALUMINUM17The United States continu
- Page 22 and 23:
ANTIMONY19Events, Trends, and Issue
- Page 24 and 25:
ARSENIC21According to university me
- Page 26 and 27:
ASBESTOS23Events, Trends, and Issue
- Page 28 and 29:
BARITE25Nationally, the rig count o
- Page 30 and 31:
BAUXITE AND ALUMINA27Events, Trends
- Page 32 and 33:
BERYLLIUM29Events, Trends, and Issu
- Page 34 and 35:
BISMUTH31Events, Trends, and Issues
- Page 36 and 37:
BORON33Events, Trends, and Issues:
- Page 38 and 39:
BROMINE35Events, Trends, and Issues
- Page 40 and 41:
CADMIUM37NiCd battery use in consum
- Page 42 and 43:
CEMENT39The manufacture of clinker
- Page 44 and 45:
CESIUM41Events, Trends, and Issues:
- Page 46 and 47:
CHROMIUM43Stockpile Status—9-30-1
- Page 48 and 49:
CLAYS45Tariff: Item Number Normal T
- Page 50 and 51:
COBALT47Events, Trends, and Issues:
- Page 52 and 53:
COPPER49Events, Trends, and Issues:
- Page 54 and 55:
DIAMOND (INDUSTRIAL)51Events, Trend
- Page 56 and 57:
DIATOMITE53Events, Trends, and Issu
- Page 58 and 59:
FELDSPAR55Feldspar use in tile and
- Page 60 and 61:
FLUORSPAR57with planned output of 1
- Page 62 and 63:
GALLIUM59In response to the unprece
- Page 64 and 65:
GARNET (INDUSTRIAL)61Events, Trends
- Page 66 and 67: GEMSTONES63Events, Trends, and Issu
- Page 68 and 69: GERMANIUM65Events, Trends, and Issu
- Page 70 and 71: GOLD67With the increase in price of
- Page 72 and 73: GRAPHITE (NATURAL)69Events, Trends,
- Page 74 and 75: GYPSUM71Through 2010, more than 3,6
- Page 76 and 77: HELIUM73Events, Trends, and Issues:
- Page 78 and 79: INDIUM75China’s 21 indium produce
- Page 80 and 81: IODINE77Events, Trends, and Issues:
- Page 82 and 83: IRON AND STEEL79Events, Trends, and
- Page 84 and 85: IRON AND STEEL SCRAP81Tariff: Item
- Page 86 and 87: IRON AND STEEL SLAG83Events, Trends
- Page 88 and 89: IRON ORE85In 2009, China imported a
- Page 90 and 91: IRON OXIDE PIGMENTS87Events, Trends
- Page 92 and 93: KYANITE AND RELATED MATERIALS89Even
- Page 94 and 95: LEAD91caused by underground fires a
- Page 96 and 97: LIME93The lime industry is facing p
- Page 98 and 99: LITHIUM95market, and a facility at
- Page 100 and 101: MAGNESIUM COMPOUNDS97In Australia,
- Page 102 and 103: MAGNESIUM METAL99U.S. magnesium con
- Page 104 and 105: MANGANESE101Government Stockpile:St
- Page 106 and 107: MERCURY103Events, Trends, and Issue
- Page 108 and 109: MICA (NATURAL)105Depletion Allowanc
- Page 110 and 111: MOLYBDENUM107Events, Trends, and Is
- Page 112 and 113: NICKEL109Nickel prices were adverse
- Page 114 and 115: NIOBIUM (COLUMBIUM)111Events, Trend
- Page 118 and 119: PEAT115Events, Trends, and Issues:
- Page 120 and 121: PERLITE117Events, Trends, and Issue
- Page 122 and 123: PHOSPHATE ROCK119Events, Trends, an
- Page 124 and 125: PLATINUM-GROUP METALS121Events, Tre
- Page 126 and 127: POTASH123Events, Trends, and Issues
- Page 128 and 129: PUMICE AND PUMICITE125Events, Trend
- Page 130 and 131: QUARTZ CRYSTAL (INDUSTRIAL)127Event
- Page 132 and 133: RARE EARTHS129Events, Trends, and I
- Page 134 and 135: RHENIUM131Events, Trends, and Issue
- Page 136 and 137: RUBIDIUM133Events, Trends, and Issu
- Page 138 and 139: SALT135Many chefs have advocated us
- Page 140 and 141: SAND AND GRAVEL (CONSTRUCTION)137Ev
- Page 142 and 143: SAND AND GRAVEL (INDUSTRIAL)139The
- Page 144 and 145: SCANDIUM141Scandium’s use in meta
- Page 146 and 147: SELENIUM143Events, Trends, and Issu
- Page 148 and 149: SILICON145Events, Trends, and Issue
- Page 150 and 151: SILVER147Silver was used as a repla
- Page 152 and 153: SODA ASH149A Wyoming soda ash produ
- Page 154 and 155: SODIUM SULFATE151Events, Trends, an
- Page 156 and 157: STONE (CRUSHED)153Events, Trends, a
- Page 158 and 159: STONE (DIMENSION)155Events, Trends,
- Page 160 and 161: STRONTIUM157Events, Trends, and Iss
- Page 162 and 163: SULFUR159World sulfur production in
- Page 164 and 165: TALC AND PYROPHYLLITE161Events, Tre
- Page 166 and 167:
TANTALUM163Events, Trends, and Issu
- Page 168 and 169:
TELLURIUM165Events, Trends, and Iss
- Page 170:
THALLIUM167Beginning in 2009, there
- Page 173 and 174:
170TIN(Data in metric tons of tin c
- Page 175 and 176:
172TITANIUM AND TITANIUM DIOXIDE 1(
- Page 177 and 178:
174TITANIUM MINERAL CONCENTRATES 1(
- Page 179 and 180:
176TUNGSTEN(Data in metric tons of
- Page 181 and 182:
178VANADIUM(Data in metric tons of
- Page 183 and 184:
180VERMICULITE(Data in thousand met
- Page 185 and 186:
182WOLLASTONITE(Data in metric tons
- Page 187 and 188:
184YTTRIUM 1(Data in metric tons of
- Page 189 and 190:
186ZEOLITES (NATURAL)(Data in metri
- Page 191 and 192:
188ZINC(Data in thousand metric ton
- Page 193 and 194:
190ZIRCONIUM AND HAFNIUM(Data in me
- Page 195 and 196:
192APPENDIX AAbbreviations and Unit
- Page 197 and 198:
194Demonstrated.—A term for the s
- Page 199 and 200:
196Part B—Sources of Reserves Dat
- Page 201:
198Europe and Central Eurasia—con