ZINC189Events, Trends, <strong>and</strong> Issues: Global zinc mine production in 2010 was forecast to increase to 12 million tons, mostlyowing to increases in zinc mine production in Australia <strong>and</strong> China. According to the International Lead <strong>and</strong> Zinc StudyGroup, refined metal production increased by 11% to 12.5 million tons, while world metal consumption increased by13% to 12.3 million tons, resulting in a market surplus of 233,000 tons of metal. A smaller surplus is anticipated in<strong>2011</strong>. Dem<strong>and</strong> for zinc generally follows industrial production or, more generally, global economic growth. Globaleconomic activity exp<strong>and</strong>ed during 2010, albeit at a sluggish pace. The rate of growth in the United States <strong>and</strong> Japanwas slower than that of Europe <strong>and</strong> the major emerging economies—most notably Brazil, China, <strong>and</strong> India. The risein global zinc consumption in 2010 was credited to a strong recovery of consumption in Europe (24%) as well ascontinued strong growth in consumption in China (11%).Domestically, production continued to ramp up at two recently reopened zinc mining complexes in Tennessee.However, overall zinc mine production decreased in 2010 from that of 2009 owing to the loss of production frommines in Montana <strong>and</strong> Washington, both of which had ceased operations in 2009. Primary production returned tonormal levels in 2010, as production at the zinc refinery in Tennessee was near capacity throughout the year.Secondary zinc production decreased from that of 2009, as the zinc smelter in Pennsylvania halted production fromJuly through November as a result of a fire at the plant.After declining through the first half of the year, average monthly zinc prices rebounded during the second half of2010. The LME cash price for Special High Grade zinc averaged 110 cents per pound in January, decreased to 79cents per pound by midyear, <strong>and</strong> then rose to 106 cents per pound by October.World Mine Production <strong>and</strong> Reserves: Reserves estimates were revised, excluding Australia <strong>and</strong> China, based ona commercially available database of reserves <strong>and</strong> resources of mines <strong>and</strong> potential mines.Mine production 9 Reserves 102009 2010 eUnited States 736 720 12,000Australia 1,290 1,450 53,000Bolivia 422 430 6,000Canada 699 670 6,000China 3,100 3,500 42,000India 695 750 11,000Irel<strong>and</strong> 386 350 2,000Kazakhstan 480 480 16,000Mexico 390 550 15,000Peru 1,510 1,520 23,000Other countries 1,490 1,58062,000World total (rounded) 11,200 12,000 250,000World Resources: Identified zinc resources of the world are about 1.9 billion metric tons.Substitutes: Aluminum, plastics, <strong>and</strong> steel substitute for galvanized sheet. Aluminum, magnesium, <strong>and</strong> plastics aremajor competitors as diecasting materials. Aluminum alloy, cadmium, paint, <strong>and</strong> plastic coatings replace zinc forcorrosion protection; aluminum alloys substitute for brass. Many elements are substitutes for zinc in chemical,electronic, <strong>and</strong> pigment uses.e Estimated. — Zero.1 Less than ½ unit.2 Platts Metals Week price for North American Special High Grade zinc; based on the London Metal Exchange cash price plus premiums ordiscounts, depending on market conditions.3 Includes mine <strong>and</strong> mill employment at all zinc-producing mines. Source: Mine Safety <strong>and</strong> Health Administration.4 Defined as imports – exports + adjustments for Government <strong>and</strong> industry stock changes.5 No tariff for Canada, Mexico, <strong>and</strong> Peru for items shown.6 See Appendix B for definitions.7 Sales of zinc under Basic Ordering Agreement DLA-ZINC-004 were suspended on August 6, 2008.8 Actual quantity limited to remaining inventory.9 Zinc content of concentrate <strong>and</strong> direct shipping ore.10 See Appendix C for resource/reserve definitions <strong>and</strong> information concerning data sources.U.S. Geological Survey, <strong>Mineral</strong> <strong>Commodity</strong> <strong>Summaries</strong>, January <strong>2011</strong>
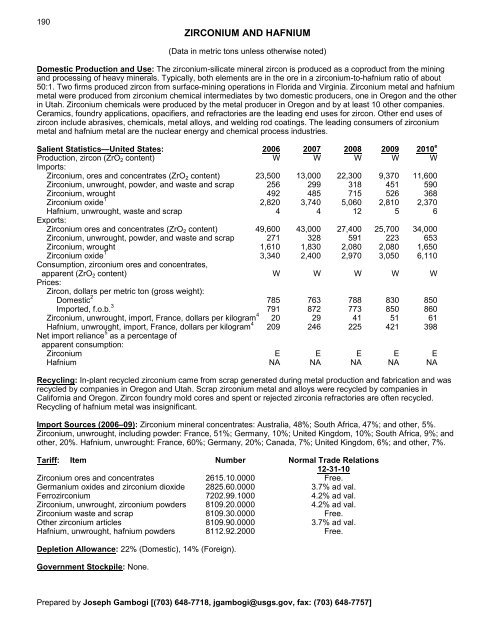
190ZIRCONIUM AND HAFNIUM(Data in metric tons unless otherwise noted)Domestic Production <strong>and</strong> Use: The zirconium-silicate mineral zircon is produced as a coproduct from the mining<strong>and</strong> processing of heavy minerals. Typically, both elements are in the ore in a zirconium-to-hafnium ratio of about50:1. Two firms produced zircon from surface-mining operations in Florida <strong>and</strong> Virginia. Zirconium metal <strong>and</strong> hafniummetal were produced from zirconium chemical intermediates by two domestic producers, one in Oregon <strong>and</strong> the otherin Utah. Zirconium chemicals were produced by the metal producer in Oregon <strong>and</strong> by at least 10 other companies.Ceramics, foundry applications, opacifiers, <strong>and</strong> refractories are the leading end uses for zircon. Other end uses ofzircon include abrasives, chemicals, metal alloys, <strong>and</strong> welding rod coatings. The leading consumers of zirconiummetal <strong>and</strong> hafnium metal are the nuclear energy <strong>and</strong> chemical process industries.Salient Statistics—United States: 2006 2007 2008 2009 2010 eProduction, zircon (ZrO 2 content) W W W W WImports:Zirconium, ores <strong>and</strong> concentrates (ZrO 2 content) 23,500 13,000 22,300 9,370 11,600Zirconium, unwrought, powder, <strong>and</strong> waste <strong>and</strong> scrap 256 299 318 451 590Zirconium, wrought 492 485 715 526 368Zirconium oxide 1 2,820 3,740 5,060 2,810 2,370Hafnium, unwrought, waste <strong>and</strong> scrap 4 4 12 5 6Exports:Zirconium ores <strong>and</strong> concentrates (ZrO 2 content) 49,600 43,000 27,400 25,700 34,000Zirconium, unwrought, powder, <strong>and</strong> waste <strong>and</strong> scrap 271 328 591 223 653Zirconium, wrought 1,610 1,830 2,080 2,080 1,650Zirconium oxide 1 3,340 2,400 2,970 3,050 6,110Consumption, zirconium ores <strong>and</strong> concentrates,apparent (ZrO 2 content) W W W W WPrices:Zircon, dollars per metric ton (gross weight):Domestic 2 785 763 788 830 850Imported, f.o.b. 3 791 872 773 850 860Zirconium, unwrought, import, France, dollars per kilogram 4 20 29 41 51 61Hafnium, unwrought, import, France, dollars per kilogram 4 209 246 225 421 398Net import reliance 5 as a percentage ofapparent consumption:Zirconium E E E E EHafnium NA NA NA NA NARecycling: In-plant recycled zirconium came from scrap generated during metal production <strong>and</strong> fabrication <strong>and</strong> wasrecycled by companies in Oregon <strong>and</strong> Utah. Scrap zirconium metal <strong>and</strong> alloys were recycled by companies inCalifornia <strong>and</strong> Oregon. Zircon foundry mold cores <strong>and</strong> spent or rejected zirconia refractories are often recycled.Recycling of hafnium metal was insignificant.Import Sources (2006–09): Zirconium mineral concentrates: Australia, 48%; South Africa, 47%; <strong>and</strong> other, 5%.Zirconium, unwrought, including powder: France, 51%; Germany, 10%; United Kingdom, 10%; South Africa, 9%; <strong>and</strong>other, 20%. Hafnium, unwrought: France, 60%; Germany, 20%; Canada, 7%; United Kingdom, 6%; <strong>and</strong> other, 7%.Tariff: Item Number Normal Trade Relations12-31-10Zirconium ores <strong>and</strong> concentrates 2615.10.0000 Free.Germanium oxides <strong>and</strong> zirconium dioxide 2825.60.0000 3.7% ad val.Ferrozirconium 7202.99.1000 4.2% ad val.Zirconium, unwrought, zirconium powders 8109.20.0000 4.2% ad val.Zirconium waste <strong>and</strong> scrap 8109.30.0000 Free.Other zirconium articles 8109.90.0000 3.7% ad val.Hafnium, unwrought, hafnium powders 8112.92.2000 Free.Depletion Allowance: 22% (Domestic), 14% (Foreign).Government Stockpile: None.Prepared by Joseph Gambogi [(703) 648-7718, jgambogi@usgs.gov, fax: (703) 648-7757]
- Page 3:
U.S. Department of the InteriorKEN
- Page 6 and 7:
INTRODUCTION3Each chapter of the 20
- Page 8 and 9:
5NET EXPORTS OF MINERALRAW MATERIAL
- Page 10 and 11:
SIGNIFICANT EVENTS, TRENDS, AND ISS
- Page 12 and 13:
mineral materials valued at $1.30 b
- Page 14 and 15:
11MAJOR METAL-PRODUCING AREASAuB2P1
- Page 16 and 17:
13MAJOR INDUSTRIAL MINERAL-PRODUCIN
- Page 18 and 19:
ABRASIVES (MANUFACTURED)15Events, T
- Page 20 and 21:
ALUMINUM17The United States continu
- Page 22 and 23:
ANTIMONY19Events, Trends, and Issue
- Page 24 and 25:
ARSENIC21According to university me
- Page 26 and 27:
ASBESTOS23Events, Trends, and Issue
- Page 28 and 29:
BARITE25Nationally, the rig count o
- Page 30 and 31:
BAUXITE AND ALUMINA27Events, Trends
- Page 32 and 33:
BERYLLIUM29Events, Trends, and Issu
- Page 34 and 35:
BISMUTH31Events, Trends, and Issues
- Page 36 and 37:
BORON33Events, Trends, and Issues:
- Page 38 and 39:
BROMINE35Events, Trends, and Issues
- Page 40 and 41:
CADMIUM37NiCd battery use in consum
- Page 42 and 43:
CEMENT39The manufacture of clinker
- Page 44 and 45:
CESIUM41Events, Trends, and Issues:
- Page 46 and 47:
CHROMIUM43Stockpile Status—9-30-1
- Page 48 and 49:
CLAYS45Tariff: Item Number Normal T
- Page 50 and 51:
COBALT47Events, Trends, and Issues:
- Page 52 and 53:
COPPER49Events, Trends, and Issues:
- Page 54 and 55:
DIAMOND (INDUSTRIAL)51Events, Trend
- Page 56 and 57:
DIATOMITE53Events, Trends, and Issu
- Page 58 and 59:
FELDSPAR55Feldspar use in tile and
- Page 60 and 61:
FLUORSPAR57with planned output of 1
- Page 62 and 63:
GALLIUM59In response to the unprece
- Page 64 and 65:
GARNET (INDUSTRIAL)61Events, Trends
- Page 66 and 67:
GEMSTONES63Events, Trends, and Issu
- Page 68 and 69:
GERMANIUM65Events, Trends, and Issu
- Page 70 and 71:
GOLD67With the increase in price of
- Page 72 and 73:
GRAPHITE (NATURAL)69Events, Trends,
- Page 74 and 75:
GYPSUM71Through 2010, more than 3,6
- Page 76 and 77:
HELIUM73Events, Trends, and Issues:
- Page 78 and 79:
INDIUM75China’s 21 indium produce
- Page 80 and 81:
IODINE77Events, Trends, and Issues:
- Page 82 and 83:
IRON AND STEEL79Events, Trends, and
- Page 84 and 85:
IRON AND STEEL SCRAP81Tariff: Item
- Page 86 and 87:
IRON AND STEEL SLAG83Events, Trends
- Page 88 and 89:
IRON ORE85In 2009, China imported a
- Page 90 and 91:
IRON OXIDE PIGMENTS87Events, Trends
- Page 92 and 93:
KYANITE AND RELATED MATERIALS89Even
- Page 94 and 95:
LEAD91caused by underground fires a
- Page 96 and 97:
LIME93The lime industry is facing p
- Page 98 and 99:
LITHIUM95market, and a facility at
- Page 100 and 101:
MAGNESIUM COMPOUNDS97In Australia,
- Page 102 and 103:
MAGNESIUM METAL99U.S. magnesium con
- Page 104 and 105:
MANGANESE101Government Stockpile:St
- Page 106 and 107:
MERCURY103Events, Trends, and Issue
- Page 108 and 109:
MICA (NATURAL)105Depletion Allowanc
- Page 110 and 111:
MOLYBDENUM107Events, Trends, and Is
- Page 112 and 113:
NICKEL109Nickel prices were adverse
- Page 114 and 115:
NIOBIUM (COLUMBIUM)111Events, Trend
- Page 116 and 117:
NITROGEN (FIXED)—AMMONIA113Accord
- Page 118 and 119:
PEAT115Events, Trends, and Issues:
- Page 120 and 121:
PERLITE117Events, Trends, and Issue
- Page 122 and 123:
PHOSPHATE ROCK119Events, Trends, an
- Page 124 and 125:
PLATINUM-GROUP METALS121Events, Tre
- Page 126 and 127:
POTASH123Events, Trends, and Issues
- Page 128 and 129:
PUMICE AND PUMICITE125Events, Trend
- Page 130 and 131:
QUARTZ CRYSTAL (INDUSTRIAL)127Event
- Page 132 and 133:
RARE EARTHS129Events, Trends, and I
- Page 134 and 135:
RHENIUM131Events, Trends, and Issue
- Page 136 and 137:
RUBIDIUM133Events, Trends, and Issu
- Page 138 and 139:
SALT135Many chefs have advocated us
- Page 140 and 141:
SAND AND GRAVEL (CONSTRUCTION)137Ev
- Page 142 and 143: SAND AND GRAVEL (INDUSTRIAL)139The
- Page 144 and 145: SCANDIUM141Scandium’s use in meta
- Page 146 and 147: SELENIUM143Events, Trends, and Issu
- Page 148 and 149: SILICON145Events, Trends, and Issue
- Page 150 and 151: SILVER147Silver was used as a repla
- Page 152 and 153: SODA ASH149A Wyoming soda ash produ
- Page 154 and 155: SODIUM SULFATE151Events, Trends, an
- Page 156 and 157: STONE (CRUSHED)153Events, Trends, a
- Page 158 and 159: STONE (DIMENSION)155Events, Trends,
- Page 160 and 161: STRONTIUM157Events, Trends, and Iss
- Page 162 and 163: SULFUR159World sulfur production in
- Page 164 and 165: TALC AND PYROPHYLLITE161Events, Tre
- Page 166 and 167: TANTALUM163Events, Trends, and Issu
- Page 168 and 169: TELLURIUM165Events, Trends, and Iss
- Page 170: THALLIUM167Beginning in 2009, there
- Page 173 and 174: 170TIN(Data in metric tons of tin c
- Page 175 and 176: 172TITANIUM AND TITANIUM DIOXIDE 1(
- Page 177 and 178: 174TITANIUM MINERAL CONCENTRATES 1(
- Page 179 and 180: 176TUNGSTEN(Data in metric tons of
- Page 181 and 182: 178VANADIUM(Data in metric tons of
- Page 183 and 184: 180VERMICULITE(Data in thousand met
- Page 185 and 186: 182WOLLASTONITE(Data in metric tons
- Page 187 and 188: 184YTTRIUM 1(Data in metric tons of
- Page 189 and 190: 186ZEOLITES (NATURAL)(Data in metri
- Page 191: 188ZINC(Data in thousand metric ton
- Page 195 and 196: 192APPENDIX AAbbreviations and Unit
- Page 197 and 198: 194Demonstrated.—A term for the s
- Page 199 and 200: 196Part B—Sources of Reserves Dat
- Page 201: 198Europe and Central Eurasia—con