ABRASIVES (MANUFACTURED)15Events, Trends, <strong>and</strong> Issues: Imports <strong>and</strong> higher operating costs continued to challenge abrasives producers in theUnited States <strong>and</strong> Canada. Foreign competition, particularly from China, is expected to persist <strong>and</strong> further curtailproduction in North America. Abrasives markets are greatly influenced by activity in the manufacturing sector in theUnited States. During 2009, downturns in the U.S. manufacturing sector, owing to the impacts of the global economicrecession, caused modest decreases in U.S. manufactured abrasives production, but significant decreases inconsumption. This was particularly true of manufacturing activities in the aerospace, automotive, furniture, housing,<strong>and</strong> steel industries. The U.S. abrasive markets also are influenced by economic <strong>and</strong> technological trends. As theworld <strong>and</strong> the United States slowly began to recover from the global economic recession during 2010, U.S.manufactured abrasives production <strong>and</strong> consumption also slowly began to show signs of improvement. After largedrops in the imports of aluminum oxide <strong>and</strong> silicon carbide in 2009, imports began to increase during 2010. Globalprices of abrasive aluminum oxide <strong>and</strong> silicon carbide, which had leveled out or dropped during the first three quartersof 2009, began moving steadily higher in the last quarter of 2009. This price trend continued through 2010.World Production Capacity:Fused aluminum oxideSilicon carbide2009 2010 2009 2010United States <strong>and</strong> Canada 60,400 60,400 42,600 42,600Argentina — — 5,000 5,000Australia 50,000 50,000 — —Austria 60,000 60,000 — —Brazil 50,000 50,000 43,000 43,000China 700,000 700,000 455,000 455,000France 40,000 40,000 16,000 16,000Germany 80,000 80,000 36,000 36,000India 40,000 40,000 5,000 5,000Japan 25,000 25,000 60,000 60,000Mexico — — 45,000 45,000Norway — — 80,000 80,000Venezuela — — 30,000 30,000Other countries 80,000 80,000 190,000 190,000World total (rounded) 1,190,000 1,190,000 1,010,000 1,010,000World Resources: Although domestic resources of raw materials for the production of fused aluminum oxide arerather limited, adequate resources are available in the Western Hemisphere. Domestic resources are more thanadequate for the production of silicon carbide.Substitutes: Natural <strong>and</strong> manufactured abrasives, such as garnet, emery, or metallic abrasives, can be substitutedfor fused aluminum oxide <strong>and</strong> silicon carbide in various applications.e Estimated. NA Not available. — Zero.1 Rounded to the nearest 5,000 tons to protect proprietary data.2 Defined as imports – exports + adjustments for Government <strong>and</strong> industry stock changes.U.S. Geological Survey, <strong>Mineral</strong> <strong>Commodity</strong> <strong>Summaries</strong>, January <strong>2011</strong>
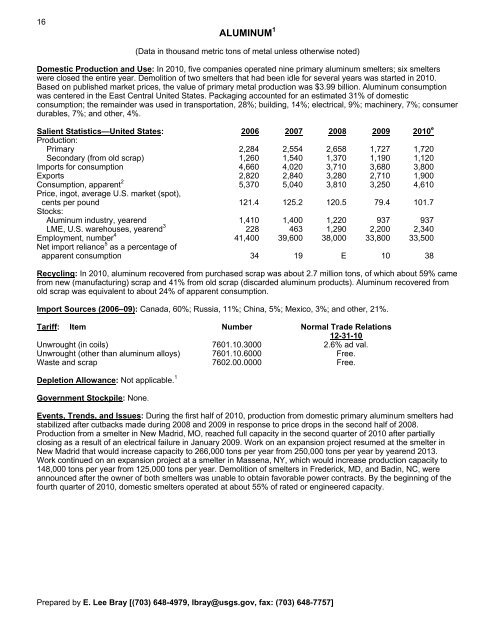
16ALUMINUM 1(Data in thous<strong>and</strong> metric tons of metal unless otherwise noted)Domestic Production <strong>and</strong> Use: In 2010, five companies operated nine primary aluminum smelters; six smelterswere closed the entire year. Demolition of two smelters that had been idle for several years was started in 2010.Based on published market prices, the value of primary metal production was $3.99 billion. Aluminum consumptionwas centered in the East Central United States. Packaging accounted for an estimated 31% of domesticconsumption; the remainder was used in transportation, 28%; building, 14%; electrical, 9%; machinery, 7%; consumerdurables, 7%; <strong>and</strong> other, 4%.Salient Statistics—United States: 2006 2007 2008 2009 2010 eProduction:Primary 2,284 2,554 2,658 1,727 1,720Secondary (from old scrap) 1,260 1,540 1,370 1,190 1,120Imports for consumption 4,660 4,020 3,710 3,680 3,800Exports 2,820 2,840 3,280 2,710 1,900Consumption, apparent 2 5,370 5,040 3,810 3,250 4,610Price, ingot, average U.S. market (spot),cents per pound 121.4 125.2 120.5 79.4 101.7Stocks:Aluminum industry, yearend 1,410 1,400 1,220 937 937LME, U.S. warehouses, yearend 3 228 463 1,290 2,200 2,340Employment, number 4 41,400 39,600 38,000 33,800 33,500Net import reliance 5 as a percentage ofapparent consumption 34 19 E 10 38Recycling: In 2010, aluminum recovered from purchased scrap was about 2.7 million tons, of which about 59% camefrom new (manufacturing) scrap <strong>and</strong> 41% from old scrap (discarded aluminum products). Aluminum recovered fromold scrap was equivalent to about 24% of apparent consumption.Import Sources (2006–09): Canada, 60%; Russia, 11%; China, 5%; Mexico, 3%; <strong>and</strong> other, 21%.Tariff: Item Number Normal Trade Relations12-31-10Unwrought (in coils) 7601.10.3000 2.6% ad val.Unwrought (other than aluminum alloys) 7601.10.6000 Free.Waste <strong>and</strong> scrap 7602.00.0000 Free.Depletion Allowance: Not applicable. 1Government Stockpile: None.Events, Trends, <strong>and</strong> Issues: During the first half of 2010, production from domestic primary aluminum smelters hadstabilized after cutbacks made during 2008 <strong>and</strong> 2009 in response to price drops in the second half of 2008.Production from a smelter in New Madrid, MO, reached full capacity in the second quarter of 2010 after partiallyclosing as a result of an electrical failure in January 2009. Work on an expansion project resumed at the smelter inNew Madrid that would increase capacity to 266,000 tons per year from 250,000 tons per year by yearend 2013.Work continued on an expansion project at a smelter in Massena, NY, which would increase production capacity to148,000 tons per year from 125,000 tons per year. Demolition of smelters in Frederick, MD, <strong>and</strong> Badin, NC, wereannounced after the owner of both smelters was unable to obtain favorable power contracts. By the beginning of thefourth quarter of 2010, domestic smelters operated at about 55% of rated or engineered capacity.Prepared by E. Lee Bray [(703) 648-4979, lbray@usgs.gov, fax: (703) 648-7757]
- Page 3: U.S. Department of the InteriorKEN
- Page 6 and 7: INTRODUCTION3Each chapter of the 20
- Page 8 and 9: 5NET EXPORTS OF MINERALRAW MATERIAL
- Page 10 and 11: SIGNIFICANT EVENTS, TRENDS, AND ISS
- Page 12 and 13: mineral materials valued at $1.30 b
- Page 14 and 15: 11MAJOR METAL-PRODUCING AREASAuB2P1
- Page 16 and 17: 13MAJOR INDUSTRIAL MINERAL-PRODUCIN
- Page 20 and 21: ALUMINUM17The United States continu
- Page 22 and 23: ANTIMONY19Events, Trends, and Issue
- Page 24 and 25: ARSENIC21According to university me
- Page 26 and 27: ASBESTOS23Events, Trends, and Issue
- Page 28 and 29: BARITE25Nationally, the rig count o
- Page 30 and 31: BAUXITE AND ALUMINA27Events, Trends
- Page 32 and 33: BERYLLIUM29Events, Trends, and Issu
- Page 34 and 35: BISMUTH31Events, Trends, and Issues
- Page 36 and 37: BORON33Events, Trends, and Issues:
- Page 38 and 39: BROMINE35Events, Trends, and Issues
- Page 40 and 41: CADMIUM37NiCd battery use in consum
- Page 42 and 43: CEMENT39The manufacture of clinker
- Page 44 and 45: CESIUM41Events, Trends, and Issues:
- Page 46 and 47: CHROMIUM43Stockpile Status—9-30-1
- Page 48 and 49: CLAYS45Tariff: Item Number Normal T
- Page 50 and 51: COBALT47Events, Trends, and Issues:
- Page 52 and 53: COPPER49Events, Trends, and Issues:
- Page 54 and 55: DIAMOND (INDUSTRIAL)51Events, Trend
- Page 56 and 57: DIATOMITE53Events, Trends, and Issu
- Page 58 and 59: FELDSPAR55Feldspar use in tile and
- Page 60 and 61: FLUORSPAR57with planned output of 1
- Page 62 and 63: GALLIUM59In response to the unprece
- Page 64 and 65: GARNET (INDUSTRIAL)61Events, Trends
- Page 66 and 67: GEMSTONES63Events, Trends, and Issu
- Page 68 and 69:
GERMANIUM65Events, Trends, and Issu
- Page 70 and 71:
GOLD67With the increase in price of
- Page 72 and 73:
GRAPHITE (NATURAL)69Events, Trends,
- Page 74 and 75:
GYPSUM71Through 2010, more than 3,6
- Page 76 and 77:
HELIUM73Events, Trends, and Issues:
- Page 78 and 79:
INDIUM75China’s 21 indium produce
- Page 80 and 81:
IODINE77Events, Trends, and Issues:
- Page 82 and 83:
IRON AND STEEL79Events, Trends, and
- Page 84 and 85:
IRON AND STEEL SCRAP81Tariff: Item
- Page 86 and 87:
IRON AND STEEL SLAG83Events, Trends
- Page 88 and 89:
IRON ORE85In 2009, China imported a
- Page 90 and 91:
IRON OXIDE PIGMENTS87Events, Trends
- Page 92 and 93:
KYANITE AND RELATED MATERIALS89Even
- Page 94 and 95:
LEAD91caused by underground fires a
- Page 96 and 97:
LIME93The lime industry is facing p
- Page 98 and 99:
LITHIUM95market, and a facility at
- Page 100 and 101:
MAGNESIUM COMPOUNDS97In Australia,
- Page 102 and 103:
MAGNESIUM METAL99U.S. magnesium con
- Page 104 and 105:
MANGANESE101Government Stockpile:St
- Page 106 and 107:
MERCURY103Events, Trends, and Issue
- Page 108 and 109:
MICA (NATURAL)105Depletion Allowanc
- Page 110 and 111:
MOLYBDENUM107Events, Trends, and Is
- Page 112 and 113:
NICKEL109Nickel prices were adverse
- Page 114 and 115:
NIOBIUM (COLUMBIUM)111Events, Trend
- Page 116 and 117:
NITROGEN (FIXED)—AMMONIA113Accord
- Page 118 and 119:
PEAT115Events, Trends, and Issues:
- Page 120 and 121:
PERLITE117Events, Trends, and Issue
- Page 122 and 123:
PHOSPHATE ROCK119Events, Trends, an
- Page 124 and 125:
PLATINUM-GROUP METALS121Events, Tre
- Page 126 and 127:
POTASH123Events, Trends, and Issues
- Page 128 and 129:
PUMICE AND PUMICITE125Events, Trend
- Page 130 and 131:
QUARTZ CRYSTAL (INDUSTRIAL)127Event
- Page 132 and 133:
RARE EARTHS129Events, Trends, and I
- Page 134 and 135:
RHENIUM131Events, Trends, and Issue
- Page 136 and 137:
RUBIDIUM133Events, Trends, and Issu
- Page 138 and 139:
SALT135Many chefs have advocated us
- Page 140 and 141:
SAND AND GRAVEL (CONSTRUCTION)137Ev
- Page 142 and 143:
SAND AND GRAVEL (INDUSTRIAL)139The
- Page 144 and 145:
SCANDIUM141Scandium’s use in meta
- Page 146 and 147:
SELENIUM143Events, Trends, and Issu
- Page 148 and 149:
SILICON145Events, Trends, and Issue
- Page 150 and 151:
SILVER147Silver was used as a repla
- Page 152 and 153:
SODA ASH149A Wyoming soda ash produ
- Page 154 and 155:
SODIUM SULFATE151Events, Trends, an
- Page 156 and 157:
STONE (CRUSHED)153Events, Trends, a
- Page 158 and 159:
STONE (DIMENSION)155Events, Trends,
- Page 160 and 161:
STRONTIUM157Events, Trends, and Iss
- Page 162 and 163:
SULFUR159World sulfur production in
- Page 164 and 165:
TALC AND PYROPHYLLITE161Events, Tre
- Page 166 and 167:
TANTALUM163Events, Trends, and Issu
- Page 168 and 169:
TELLURIUM165Events, Trends, and Iss
- Page 170:
THALLIUM167Beginning in 2009, there
- Page 173 and 174:
170TIN(Data in metric tons of tin c
- Page 175 and 176:
172TITANIUM AND TITANIUM DIOXIDE 1(
- Page 177 and 178:
174TITANIUM MINERAL CONCENTRATES 1(
- Page 179 and 180:
176TUNGSTEN(Data in metric tons of
- Page 181 and 182:
178VANADIUM(Data in metric tons of
- Page 183 and 184:
180VERMICULITE(Data in thousand met
- Page 185 and 186:
182WOLLASTONITE(Data in metric tons
- Page 187 and 188:
184YTTRIUM 1(Data in metric tons of
- Page 189 and 190:
186ZEOLITES (NATURAL)(Data in metri
- Page 191 and 192:
188ZINC(Data in thousand metric ton
- Page 193 and 194:
190ZIRCONIUM AND HAFNIUM(Data in me
- Page 195 and 196:
192APPENDIX AAbbreviations and Unit
- Page 197 and 198:
194Demonstrated.—A term for the s
- Page 199 and 200:
196Part B—Sources of Reserves Dat
- Page 201:
198Europe and Central Eurasia—con