MOLYBDENUM107Events, Trends, <strong>and</strong> Issues: U.S. mine output of molybdenum in concentrate in 2010 increased about 17% from thatof 2009. U.S. imports for consumption increased 67% from those of 2009, while U.S. exports increased slightly fromthose of 2009. Domestic roasters operated at between 80% <strong>and</strong> 90% of full production capacity in 2009, but in 2010operated close to full production levels. U.S. reported consumption decreased slightly from that of 2009 whileapparent consumption increased 57%. Mine capacity utilization in 2009 was about 82%.Molybdenum prices increased in the first half of 2010 but slowly started to decrease in the third quarter; however,molybdenum dem<strong>and</strong> remained strong. Both byproduct <strong>and</strong> primary molybdenum production levels in the UnitedStates recovered in 2010 from their relatively low levels in 2009. The Henderson Mine in Empire, CO, increasedmolybdenum production by almost 50% in 2010 from that in 2009. Byproduct molybdenum production continued to besuspended at the Chino Mine in Grant County, NM, the Morenci Mine in Greenlee County, AZ, <strong>and</strong> the Mission Minein Pima County, AZ. The Questa Mine, in Taos County, NM, suspended its primary molybdenum mine production aswell.World Mine Production <strong>and</strong> Reserves: Reserves for Canada, China, Mexico, Mongolia, Peru, <strong>and</strong> Russia wererevised based on new information published in mining companies’ annual reports.Mine production Reserves 32009 2010 e(thous<strong>and</strong> metric tons)United States 47,800 56,000 2,700Armenia 4,150 4,200 200Canada 8,840 9,100 200Chile 34,900 39,000 1,100China 93,500 94,000 4,300Iran 3,700 3,700 50Kazakhstan 380 400 130Kyrgyzstan 250 250 100Mexico 7,800 8,000 130Mongolia 3,000 3,000 160Peru 12,300 12,000 450Russia e 3,800 3,800 250Uzbekistan e 550 55060World total (rounded) 221,000 234,000 9,800World Resources: Identified resources of molybdenum in the United States amount to about 5.4 million tons, <strong>and</strong> inthe rest of the world, about 14 million tons. Molybdenum occurs as the principal metal sulfide in large low-gradeporphyry molybdenum deposits <strong>and</strong> as an associated metal sulfide in low-grade porphyry copper deposits. Resourcesof molybdenum are adequate to supply world needs for the foreseeable future.Substitutes: There is little substitution for molybdenum in its major application as an alloying element in steels <strong>and</strong>cast irons. In fact, because of the availability <strong>and</strong> versatility of molybdenum, industry has sought to develop newmaterials that benefit from the alloying properties of the metal. Potential substitutes for molybdenum includechromium, vanadium, niobium (columbium), <strong>and</strong> boron in alloy steels; tungsten in tool steels; graphite, tungsten, <strong>and</strong>tantalum for refractory materials in high-temperature electric furnaces; <strong>and</strong> chrome-orange, cadmium-red, <strong>and</strong>organic-orange pigments for molybdenum orange.e Estimated. E Net exporter.1 Time-weighted average price per kilogram of molybdenum contained in technical-grade molybdic oxide, as reported by Platts Metals Week.2 Defined as imports – exports + adjustments for Government <strong>and</strong> industry stock changes.3 See Appendix C for resource/reserve definitions <strong>and</strong> information concerning data sources.U.S. Geological Survey, <strong>Mineral</strong> <strong>Commodity</strong> <strong>Summaries</strong>, January <strong>2011</strong>
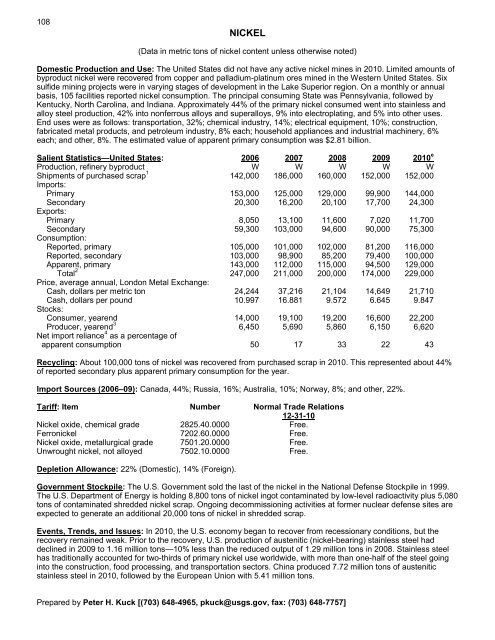
108NICKEL(Data in metric tons of nickel content unless otherwise noted)Domestic Production <strong>and</strong> Use: The United States did not have any active nickel mines in 2010. Limited amounts ofbyproduct nickel were recovered from copper <strong>and</strong> palladium-platinum ores mined in the Western United States. Sixsulfide mining projects were in varying stages of development in the Lake Superior region. On a monthly or annualbasis, 105 facilities reported nickel consumption. The principal consuming State was Pennsylvania, followed byKentucky, North Carolina, <strong>and</strong> Indiana. Approximately 44% of the primary nickel consumed went into stainless <strong>and</strong>alloy steel production, 42% into nonferrous alloys <strong>and</strong> superalloys, 9% into electroplating, <strong>and</strong> 5% into other uses.End uses were as follows: transportation, 32%; chemical industry, 14%; electrical equipment, 10%; construction,fabricated metal products, <strong>and</strong> petroleum industry, 8% each; household appliances <strong>and</strong> industrial machinery, 6%each; <strong>and</strong> other, 8%. The estimated value of apparent primary consumption was $2.81 billion.Salient Statistics—United States: 2006 2007 2008 2009 2010 eProduction, refinery byproduct W W W W WShipments of purchased scrap 1 142,000 186,000 160,000 152,000 152,000Imports:Primary 153,000 125,000 129,000 99,900 144,000Secondary 20,300 16,200 20,100 17,700 24,300Exports:Primary 8,050 13,100 11,600 7,020 11,700Secondary 59,300 103,000 94,600 90,000 75,300Consumption:Reported, primary 105,000 101,000 102,000 81,200 116,000Reported, secondary 103,000 98,900 85,200 79,400 100,000Apparent, primary 143,000 112,000 115,000 94,500 129,000Total 2 247,000 211,000 200,000 174,000 229,000Price, average annual, London Metal Exchange:Cash, dollars per metric ton 24,244 37,216 21,104 14,649 21,710Cash, dollars per pound 10.997 16.881 9.572 6.645 9.847Stocks:Consumer, yearend 14,000 19,100 19,200 16,600 22,200Producer, yearend 3 6,450 5,690 5,860 6,150 6,620Net import reliance 4 as a percentage ofapparent consumption 50 17 33 22 43Recycling: About 100,000 tons of nickel was recovered from purchased scrap in 2010. This represented about 44%of reported secondary plus apparent primary consumption for the year.Import Sources (2006–09): Canada, 44%; Russia, 16%; Australia, 10%; Norway, 8%; <strong>and</strong> other, 22%.Tariff: Item Number Normal Trade Relations12-31-10Nickel oxide, chemical grade 2825.40.0000 Free.Ferronickel 7202.60.0000 Free.Nickel oxide, metallurgical grade 7501.20.0000 Free.Unwrought nickel, not alloyed 7502.10.0000 Free.Depletion Allowance: 22% (Domestic), 14% (Foreign).Government Stockpile: The U.S. Government sold the last of the nickel in the National Defense Stockpile in 1999.The U.S. Department of <strong>Energy</strong> is holding 8,800 tons of nickel ingot contaminated by low-level radioactivity plus 5,080tons of contaminated shredded nickel scrap. Ongoing decommissioning activities at former nuclear defense sites areexpected to generate an additional 20,000 tons of nickel in shredded scrap.Events, Trends, <strong>and</strong> Issues: In 2010, the U.S. economy began to recover from recessionary conditions, but therecovery remained weak. Prior to the recovery, U.S. production of austenitic (nickel-bearing) stainless steel haddeclined in 2009 to 1.16 million tons—10% less than the reduced output of 1.29 million tons in 2008. Stainless steelhas traditionally accounted for two-thirds of primary nickel use worldwide, with more than one-half of the steel goinginto the construction, food processing, <strong>and</strong> transportation sectors. China produced 7.72 million tons of austeniticstainless steel in 2010, followed by the European Union with 5.41 million tons.Prepared by Peter H. Kuck [(703) 648-4965, pkuck@usgs.gov, fax: (703) 648-7757]
- Page 3:
U.S. Department of the InteriorKEN
- Page 6 and 7:
INTRODUCTION3Each chapter of the 20
- Page 8 and 9:
5NET EXPORTS OF MINERALRAW MATERIAL
- Page 10 and 11:
SIGNIFICANT EVENTS, TRENDS, AND ISS
- Page 12 and 13:
mineral materials valued at $1.30 b
- Page 14 and 15:
11MAJOR METAL-PRODUCING AREASAuB2P1
- Page 16 and 17:
13MAJOR INDUSTRIAL MINERAL-PRODUCIN
- Page 18 and 19:
ABRASIVES (MANUFACTURED)15Events, T
- Page 20 and 21:
ALUMINUM17The United States continu
- Page 22 and 23:
ANTIMONY19Events, Trends, and Issue
- Page 24 and 25:
ARSENIC21According to university me
- Page 26 and 27:
ASBESTOS23Events, Trends, and Issue
- Page 28 and 29:
BARITE25Nationally, the rig count o
- Page 30 and 31:
BAUXITE AND ALUMINA27Events, Trends
- Page 32 and 33:
BERYLLIUM29Events, Trends, and Issu
- Page 34 and 35:
BISMUTH31Events, Trends, and Issues
- Page 36 and 37:
BORON33Events, Trends, and Issues:
- Page 38 and 39:
BROMINE35Events, Trends, and Issues
- Page 40 and 41:
CADMIUM37NiCd battery use in consum
- Page 42 and 43:
CEMENT39The manufacture of clinker
- Page 44 and 45:
CESIUM41Events, Trends, and Issues:
- Page 46 and 47:
CHROMIUM43Stockpile Status—9-30-1
- Page 48 and 49:
CLAYS45Tariff: Item Number Normal T
- Page 50 and 51:
COBALT47Events, Trends, and Issues:
- Page 52 and 53:
COPPER49Events, Trends, and Issues:
- Page 54 and 55:
DIAMOND (INDUSTRIAL)51Events, Trend
- Page 56 and 57:
DIATOMITE53Events, Trends, and Issu
- Page 58 and 59:
FELDSPAR55Feldspar use in tile and
- Page 60 and 61: FLUORSPAR57with planned output of 1
- Page 62 and 63: GALLIUM59In response to the unprece
- Page 64 and 65: GARNET (INDUSTRIAL)61Events, Trends
- Page 66 and 67: GEMSTONES63Events, Trends, and Issu
- Page 68 and 69: GERMANIUM65Events, Trends, and Issu
- Page 70 and 71: GOLD67With the increase in price of
- Page 72 and 73: GRAPHITE (NATURAL)69Events, Trends,
- Page 74 and 75: GYPSUM71Through 2010, more than 3,6
- Page 76 and 77: HELIUM73Events, Trends, and Issues:
- Page 78 and 79: INDIUM75China’s 21 indium produce
- Page 80 and 81: IODINE77Events, Trends, and Issues:
- Page 82 and 83: IRON AND STEEL79Events, Trends, and
- Page 84 and 85: IRON AND STEEL SCRAP81Tariff: Item
- Page 86 and 87: IRON AND STEEL SLAG83Events, Trends
- Page 88 and 89: IRON ORE85In 2009, China imported a
- Page 90 and 91: IRON OXIDE PIGMENTS87Events, Trends
- Page 92 and 93: KYANITE AND RELATED MATERIALS89Even
- Page 94 and 95: LEAD91caused by underground fires a
- Page 96 and 97: LIME93The lime industry is facing p
- Page 98 and 99: LITHIUM95market, and a facility at
- Page 100 and 101: MAGNESIUM COMPOUNDS97In Australia,
- Page 102 and 103: MAGNESIUM METAL99U.S. magnesium con
- Page 104 and 105: MANGANESE101Government Stockpile:St
- Page 106 and 107: MERCURY103Events, Trends, and Issue
- Page 108 and 109: MICA (NATURAL)105Depletion Allowanc
- Page 112 and 113: NICKEL109Nickel prices were adverse
- Page 114 and 115: NIOBIUM (COLUMBIUM)111Events, Trend
- Page 116 and 117: NITROGEN (FIXED)—AMMONIA113Accord
- Page 118 and 119: PEAT115Events, Trends, and Issues:
- Page 120 and 121: PERLITE117Events, Trends, and Issue
- Page 122 and 123: PHOSPHATE ROCK119Events, Trends, an
- Page 124 and 125: PLATINUM-GROUP METALS121Events, Tre
- Page 126 and 127: POTASH123Events, Trends, and Issues
- Page 128 and 129: PUMICE AND PUMICITE125Events, Trend
- Page 130 and 131: QUARTZ CRYSTAL (INDUSTRIAL)127Event
- Page 132 and 133: RARE EARTHS129Events, Trends, and I
- Page 134 and 135: RHENIUM131Events, Trends, and Issue
- Page 136 and 137: RUBIDIUM133Events, Trends, and Issu
- Page 138 and 139: SALT135Many chefs have advocated us
- Page 140 and 141: SAND AND GRAVEL (CONSTRUCTION)137Ev
- Page 142 and 143: SAND AND GRAVEL (INDUSTRIAL)139The
- Page 144 and 145: SCANDIUM141Scandium’s use in meta
- Page 146 and 147: SELENIUM143Events, Trends, and Issu
- Page 148 and 149: SILICON145Events, Trends, and Issue
- Page 150 and 151: SILVER147Silver was used as a repla
- Page 152 and 153: SODA ASH149A Wyoming soda ash produ
- Page 154 and 155: SODIUM SULFATE151Events, Trends, an
- Page 156 and 157: STONE (CRUSHED)153Events, Trends, a
- Page 158 and 159: STONE (DIMENSION)155Events, Trends,
- Page 160 and 161:
STRONTIUM157Events, Trends, and Iss
- Page 162 and 163:
SULFUR159World sulfur production in
- Page 164 and 165:
TALC AND PYROPHYLLITE161Events, Tre
- Page 166 and 167:
TANTALUM163Events, Trends, and Issu
- Page 168 and 169:
TELLURIUM165Events, Trends, and Iss
- Page 170:
THALLIUM167Beginning in 2009, there
- Page 173 and 174:
170TIN(Data in metric tons of tin c
- Page 175 and 176:
172TITANIUM AND TITANIUM DIOXIDE 1(
- Page 177 and 178:
174TITANIUM MINERAL CONCENTRATES 1(
- Page 179 and 180:
176TUNGSTEN(Data in metric tons of
- Page 181 and 182:
178VANADIUM(Data in metric tons of
- Page 183 and 184:
180VERMICULITE(Data in thousand met
- Page 185 and 186:
182WOLLASTONITE(Data in metric tons
- Page 187 and 188:
184YTTRIUM 1(Data in metric tons of
- Page 189 and 190:
186ZEOLITES (NATURAL)(Data in metri
- Page 191 and 192:
188ZINC(Data in thousand metric ton
- Page 193 and 194:
190ZIRCONIUM AND HAFNIUM(Data in me
- Page 195 and 196:
192APPENDIX AAbbreviations and Unit
- Page 197 and 198:
194Demonstrated.—A term for the s
- Page 199 and 200:
196Part B—Sources of Reserves Dat
- Page 201:
198Europe and Central Eurasia—con