CESIUM41Events, Trends, <strong>and</strong> Issues: Domestic cesium occurrences will remain uneconomic unless market conditionschange, such as the discovery of new end uses or increased consumption for existing end uses. Commercially usefulquantities of inexpensive cesium are available as a byproduct of the production of lithium. Increases in lithiumexploration are expected to yield discoveries of additional cesium resources, which may lead to exp<strong>and</strong>ed commercialapplications. There are no known human health issues associated with cesium, <strong>and</strong> its use has minimalenvironmental impact.Cesium’s cost <strong>and</strong> reactivity limit its viability in many applications; however, its use in cesium formate brines <strong>and</strong>nuclear medicine is showing steady growth. Cesium formate drilling operations are being undertaken in the TharDesert in Pakistan, in the North Sea off the coast of Norway, <strong>and</strong> in Argentina. In addition to its use in drilling fluid,cesium formate brine is used as a fast-acting liquid pill for releasing drill pipes differentially stuck in oil-based mud(OBM) filter cakes. The pill of formate brine rapidly destroys the OBM filter cake <strong>and</strong> allows the pipe to be jarred free.The International Atomic <strong>Energy</strong> Agency has indicated that cesium-137 is one of several radioactive materials thatmay be used in radiological dispersion devices or “dirty bombs.” Cesium-137 is now regulated in the United States bythe U.S. Nuclear Regulatory Commission (NRC) <strong>and</strong> the <strong>Environmental</strong> Protection Agency (EPA). The NRC monitorsdevices containing cesium-137, requiring material holders to obtain specific licenses for these devices. The EPAplaces a maximum allowance of cesium-137 that can be released into the air by nuclear facilities <strong>and</strong> requires thecleanup of contaminated soil <strong>and</strong> groundwater. The NRC agreed to encourage research into finding <strong>and</strong>implementing alternatives, but deemed that a near-term replacement was not practical <strong>and</strong> would be detrimental tocurrent emergency medical capabilities.World Mine Production <strong>and</strong> Reserves: Pollucite, mainly formed in association with lithium-rich, lepidolite-bearing orpetalite-bearing zoned granite pegmatites, is the principal cesium ore mineral. Cesium reserves are thereforeestimated based on the occurrence of pollucite, which is mined as a byproduct of the lithium mineral lepidolite. Mostpollucite contains 5% to 32% Cs 2 O. Data on cesium resources <strong>and</strong> mine production are either limited or not available.The main pollucite zone at Bernic Lake in Canada contains approximately 400,000 metric tons of pollucite with anaverage Cs 2 O content of 24%, <strong>and</strong> a secondary zone of approximately 100,000 metric tons of pollucite contains anaverage of 5% Cs 2 O. The next largest occurrence that may become economic is in Zimbabwe.Reserves 1Canada 70,000,000Other countriesNAWorld total (rounded) 70,000,000World Resources: World resources of cesium have not been estimated. Cesium is associated with lithium-bearingpegmatites worldwide, <strong>and</strong> cesium resources have been identified in Namibia <strong>and</strong> Zimbabwe. Smaller concentrationsare also known in brines in Chile <strong>and</strong> China <strong>and</strong> in geothermal systems in Germany, India, <strong>and</strong> Tibet.Substitutes: Cesium <strong>and</strong> rubidium can be used interchangeably in many applications because they have similarphysical properties <strong>and</strong> atomic radii. Cesium, however, is more electropositive than rubidium, making it a preferredmaterial in many applications.NA Not available.1 See Appendix C for resource/reserve definitions <strong>and</strong> information concerning data sources.U.S. Geological Survey, <strong>Mineral</strong> <strong>Commodity</strong> <strong>Summaries</strong>, January <strong>2011</strong>
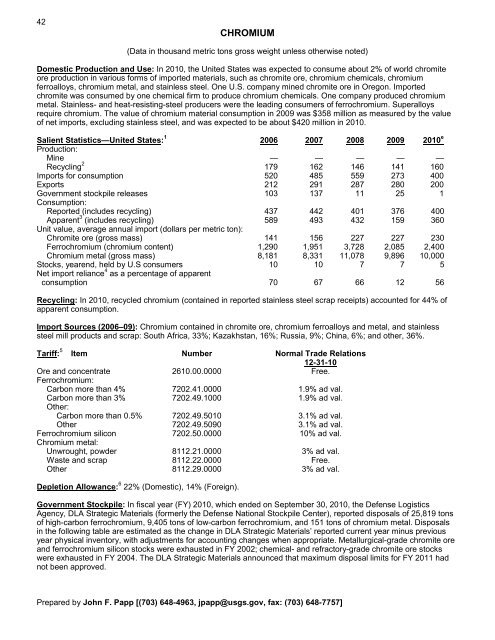
42CHROMIUM(Data in thous<strong>and</strong> metric tons gross weight unless otherwise noted)Domestic Production <strong>and</strong> Use: In 2010, the United States was expected to consume about 2% of world chromiteore production in various forms of imported materials, such as chromite ore, chromium chemicals, chromiumferroalloys, chromium metal, <strong>and</strong> stainless steel. One U.S. company mined chromite ore in Oregon. Importedchromite was consumed by one chemical firm to produce chromium chemicals. One company produced chromiummetal. Stainless- <strong>and</strong> heat-resisting-steel producers were the leading consumers of ferrochromium. Superalloysrequire chromium. The value of chromium material consumption in 2009 was $358 million as measured by the valueof net imports, excluding stainless steel, <strong>and</strong> was expected to be about $420 million in 2010.Salient Statistics—United States: 1 2006 2007 2008 2009 2010 eProduction:Mine — — — — —Recycling 2 179 162 146 141 160Imports for consumption 520 485 559 273 400Exports 212 291 287 280 200Government stockpile releases 103 137 11 25 1Consumption:Reported (includes recycling) 437 442 401 376 400Apparent 3 (includes recycling) 589 493 432 159 360Unit value, average annual import (dollars per metric ton):Chromite ore (gross mass) 141 156 227 227 230Ferrochromium (chromium content) 1,290 1,951 3,728 2,085 2,400Chromium metal (gross mass) 8,181 8,331 11,078 9,896 10,000Stocks, yearend, held by U.S consumers 10 10 7 7 5Net import reliance 4 as a percentage of apparentconsumption 70 67 66 12 56Recycling: In 2010, recycled chromium (contained in reported stainless steel scrap receipts) accounted for 44% ofapparent consumption.Import Sources (2006–09): Chromium contained in chromite ore, chromium ferroalloys <strong>and</strong> metal, <strong>and</strong> stainlesssteel mill products <strong>and</strong> scrap: South Africa, 33%; Kazakhstan, 16%; Russia, 9%; China, 6%; <strong>and</strong> other, 36%.Tariff: 5 Item Number Normal Trade Relations12-31-10Ore <strong>and</strong> concentrate 2610.00.0000 Free.Ferrochromium:Carbon more than 4% 7202.41.0000 1.9% ad val.Carbon more than 3% 7202.49.1000 1.9% ad val.Other:Carbon more than 0.5% 7202.49.5010 3.1% ad val.Other 7202.49.5090 3.1% ad val.Ferrochromium silicon 7202.50.0000 10% ad val.Chromium metal:Unwrought, powder 8112.21.0000 3% ad val.Waste <strong>and</strong> scrap 8112.22.0000 Free.Other 8112.29.0000 3% ad val.Depletion Allowance: 6 22% (Domestic), 14% (Foreign).Government Stockpile: In fiscal year (FY) 2010, which ended on September 30, 2010, the Defense LogisticsAgency, DLA Strategic Materials (formerly the Defense National Stockpile Center), reported disposals of 25,819 tonsof high-carbon ferrochromium, 9,405 tons of low-carbon ferrochromium, <strong>and</strong> 151 tons of chromium metal. Disposalsin the following table are estimated as the change in DLA Strategic Materials’ reported current year minus previousyear physical inventory, with adjustments for accounting changes when appropriate. Metallurgical-grade chromite ore<strong>and</strong> ferrochromium silicon stocks were exhausted in FY 2002; chemical- <strong>and</strong> refractory-grade chromite ore stockswere exhausted in FY 2004. The DLA Strategic Materials announced that maximum disposal limits for FY <strong>2011</strong> hadnot been approved.Prepared by John F. Papp [(703) 648-4963, jpapp@usgs.gov, fax: (703) 648-7757]
- Page 3: U.S. Department of the InteriorKEN
- Page 6 and 7: INTRODUCTION3Each chapter of the 20
- Page 8 and 9: 5NET EXPORTS OF MINERALRAW MATERIAL
- Page 10 and 11: SIGNIFICANT EVENTS, TRENDS, AND ISS
- Page 12 and 13: mineral materials valued at $1.30 b
- Page 14 and 15: 11MAJOR METAL-PRODUCING AREASAuB2P1
- Page 16 and 17: 13MAJOR INDUSTRIAL MINERAL-PRODUCIN
- Page 18 and 19: ABRASIVES (MANUFACTURED)15Events, T
- Page 20 and 21: ALUMINUM17The United States continu
- Page 22 and 23: ANTIMONY19Events, Trends, and Issue
- Page 24 and 25: ARSENIC21According to university me
- Page 26 and 27: ASBESTOS23Events, Trends, and Issue
- Page 28 and 29: BARITE25Nationally, the rig count o
- Page 30 and 31: BAUXITE AND ALUMINA27Events, Trends
- Page 32 and 33: BERYLLIUM29Events, Trends, and Issu
- Page 34 and 35: BISMUTH31Events, Trends, and Issues
- Page 36 and 37: BORON33Events, Trends, and Issues:
- Page 38 and 39: BROMINE35Events, Trends, and Issues
- Page 40 and 41: CADMIUM37NiCd battery use in consum
- Page 42 and 43: CEMENT39The manufacture of clinker
- Page 46 and 47: CHROMIUM43Stockpile Status—9-30-1
- Page 48 and 49: CLAYS45Tariff: Item Number Normal T
- Page 50 and 51: COBALT47Events, Trends, and Issues:
- Page 52 and 53: COPPER49Events, Trends, and Issues:
- Page 54 and 55: DIAMOND (INDUSTRIAL)51Events, Trend
- Page 56 and 57: DIATOMITE53Events, Trends, and Issu
- Page 58 and 59: FELDSPAR55Feldspar use in tile and
- Page 60 and 61: FLUORSPAR57with planned output of 1
- Page 62 and 63: GALLIUM59In response to the unprece
- Page 64 and 65: GARNET (INDUSTRIAL)61Events, Trends
- Page 66 and 67: GEMSTONES63Events, Trends, and Issu
- Page 68 and 69: GERMANIUM65Events, Trends, and Issu
- Page 70 and 71: GOLD67With the increase in price of
- Page 72 and 73: GRAPHITE (NATURAL)69Events, Trends,
- Page 74 and 75: GYPSUM71Through 2010, more than 3,6
- Page 76 and 77: HELIUM73Events, Trends, and Issues:
- Page 78 and 79: INDIUM75China’s 21 indium produce
- Page 80 and 81: IODINE77Events, Trends, and Issues:
- Page 82 and 83: IRON AND STEEL79Events, Trends, and
- Page 84 and 85: IRON AND STEEL SCRAP81Tariff: Item
- Page 86 and 87: IRON AND STEEL SLAG83Events, Trends
- Page 88 and 89: IRON ORE85In 2009, China imported a
- Page 90 and 91: IRON OXIDE PIGMENTS87Events, Trends
- Page 92 and 93: KYANITE AND RELATED MATERIALS89Even
- Page 94 and 95:
LEAD91caused by underground fires a
- Page 96 and 97:
LIME93The lime industry is facing p
- Page 98 and 99:
LITHIUM95market, and a facility at
- Page 100 and 101:
MAGNESIUM COMPOUNDS97In Australia,
- Page 102 and 103:
MAGNESIUM METAL99U.S. magnesium con
- Page 104 and 105:
MANGANESE101Government Stockpile:St
- Page 106 and 107:
MERCURY103Events, Trends, and Issue
- Page 108 and 109:
MICA (NATURAL)105Depletion Allowanc
- Page 110 and 111:
MOLYBDENUM107Events, Trends, and Is
- Page 112 and 113:
NICKEL109Nickel prices were adverse
- Page 114 and 115:
NIOBIUM (COLUMBIUM)111Events, Trend
- Page 116 and 117:
NITROGEN (FIXED)—AMMONIA113Accord
- Page 118 and 119:
PEAT115Events, Trends, and Issues:
- Page 120 and 121:
PERLITE117Events, Trends, and Issue
- Page 122 and 123:
PHOSPHATE ROCK119Events, Trends, an
- Page 124 and 125:
PLATINUM-GROUP METALS121Events, Tre
- Page 126 and 127:
POTASH123Events, Trends, and Issues
- Page 128 and 129:
PUMICE AND PUMICITE125Events, Trend
- Page 130 and 131:
QUARTZ CRYSTAL (INDUSTRIAL)127Event
- Page 132 and 133:
RARE EARTHS129Events, Trends, and I
- Page 134 and 135:
RHENIUM131Events, Trends, and Issue
- Page 136 and 137:
RUBIDIUM133Events, Trends, and Issu
- Page 138 and 139:
SALT135Many chefs have advocated us
- Page 140 and 141:
SAND AND GRAVEL (CONSTRUCTION)137Ev
- Page 142 and 143:
SAND AND GRAVEL (INDUSTRIAL)139The
- Page 144 and 145:
SCANDIUM141Scandium’s use in meta
- Page 146 and 147:
SELENIUM143Events, Trends, and Issu
- Page 148 and 149:
SILICON145Events, Trends, and Issue
- Page 150 and 151:
SILVER147Silver was used as a repla
- Page 152 and 153:
SODA ASH149A Wyoming soda ash produ
- Page 154 and 155:
SODIUM SULFATE151Events, Trends, an
- Page 156 and 157:
STONE (CRUSHED)153Events, Trends, a
- Page 158 and 159:
STONE (DIMENSION)155Events, Trends,
- Page 160 and 161:
STRONTIUM157Events, Trends, and Iss
- Page 162 and 163:
SULFUR159World sulfur production in
- Page 164 and 165:
TALC AND PYROPHYLLITE161Events, Tre
- Page 166 and 167:
TANTALUM163Events, Trends, and Issu
- Page 168 and 169:
TELLURIUM165Events, Trends, and Iss
- Page 170:
THALLIUM167Beginning in 2009, there
- Page 173 and 174:
170TIN(Data in metric tons of tin c
- Page 175 and 176:
172TITANIUM AND TITANIUM DIOXIDE 1(
- Page 177 and 178:
174TITANIUM MINERAL CONCENTRATES 1(
- Page 179 and 180:
176TUNGSTEN(Data in metric tons of
- Page 181 and 182:
178VANADIUM(Data in metric tons of
- Page 183 and 184:
180VERMICULITE(Data in thousand met
- Page 185 and 186:
182WOLLASTONITE(Data in metric tons
- Page 187 and 188:
184YTTRIUM 1(Data in metric tons of
- Page 189 and 190:
186ZEOLITES (NATURAL)(Data in metri
- Page 191 and 192:
188ZINC(Data in thousand metric ton
- Page 193 and 194:
190ZIRCONIUM AND HAFNIUM(Data in me
- Page 195 and 196:
192APPENDIX AAbbreviations and Unit
- Page 197 and 198:
194Demonstrated.—A term for the s
- Page 199 and 200:
196Part B—Sources of Reserves Dat
- Page 201:
198Europe and Central Eurasia—con