CHROMIUM43Stockpile Status—9-30-10 6AverageUncommitted Authorized Disposal plan Disposals chromiumMaterial inventory for disposal FY 2010 FY 2010 contentFerrochromium:High-carbon 95.4 —7 90.7 25.8 71.4%Low-carbon 59.6 — ( 7 ) 9.40 71.4%Chromium metal 4.43 — 0.907 0.151 100%Events, Trends, <strong>and</strong> Issues: Most chromite ore is converted into ferrochromium that is consumed by themetallurgical industry <strong>and</strong> most of that is consumed to make stainless <strong>and</strong> heat-resisting steel. World ingot <strong>and</strong> slabequivalent stainless <strong>and</strong> heat-resisting steel production at the end of the first half of 2010 was on track to reach 28 to34 million tons for the year. At 28 million tons, production would be about the same as that of 2006, a year of peakproduction. At 34 million tons, an historically high stainless <strong>and</strong> heat-resisting steel world production would bereached.World Mine Production <strong>and</strong> Reserves:Mine production 8 Reserves 92009 2010 e (shipping grade) 10United States — — 620India 3,760 3,800 44,000Kazakhstan 3,330 3,400 180,000South Africa 6,870 8,500 130,000Other countries 5,340 6,300NAWorld total (rounded) 19,300 22,000 >350,000World Resources: World resources are greater than 12 billion tons of shipping-grade chromite, sufficient to meetconceivable dem<strong>and</strong> for centuries. About 95% of the world’s chromium resources is geographically concentrated inKazakhstan <strong>and</strong> southern Africa; U.S. chromium resources are mostly in the Stillwater Complex in Montana.Substitutes: Chromium has no substitute in stainless steel, the leading end use, or in superalloys, the major strategicend use. Chromium-containing scrap can substitute for ferrochromium in some metallurgical uses.e Estimated. NA Not available. — Zero.1 Data in thous<strong>and</strong> metric tons of contained chromium unless otherwise noted.2 Recycling production is based on reported stainless steel scrap receipts.3 Calculated consumption of chromium; equal to production (from mines <strong>and</strong> recycling) + imports – exports + stock adjustments.4 Defined as imports – exports + adjustments for Government <strong>and</strong> industry stock changes.5 In addition to the tariff items listed, certain imported chromium materials (see 26 U.S.C. sec. 4661, 4662, <strong>and</strong> 4672) are subject to excise tax.6 See Appendix B for definitions.7 Disposal plan for ferrochromium without distinction between high-carbon <strong>and</strong> low-carbon ferrochromium; total included in high-carbon.8 Mine production units are thous<strong>and</strong> metric tons, gross weight, of marketable chromite ore.9 See Appendix C for resource/reserve definitions <strong>and</strong> information concerning data sources.10 Reserves units are thous<strong>and</strong> metric tons of shipping-grade chromite ore, which is deposit quantity <strong>and</strong> grade normalized to 45% Cr 2O 3.U.S. Geological Survey, <strong>Mineral</strong> <strong>Commodity</strong> <strong>Summaries</strong>, January <strong>2011</strong>
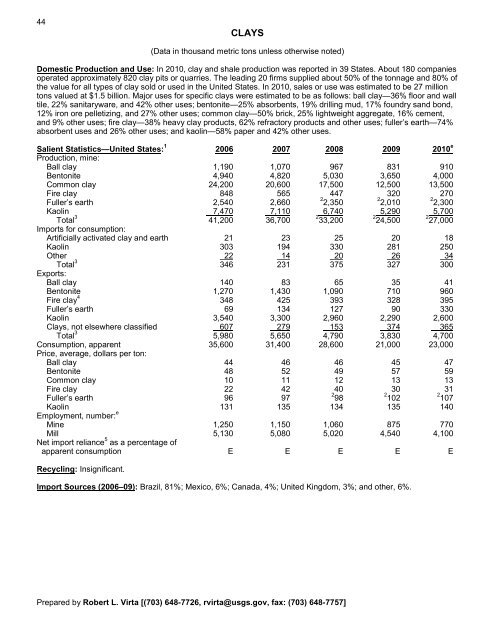
44CLAYS(Data in thous<strong>and</strong> metric tons unless otherwise noted)Domestic Production <strong>and</strong> Use: In 2010, clay <strong>and</strong> shale production was reported in 39 States. About 180 companiesoperated approximately 820 clay pits or quarries. The leading 20 firms supplied about 50% of the tonnage <strong>and</strong> 80% ofthe value for all types of clay sold or used in the United States. In 2010, sales or use was estimated to be 27 milliontons valued at $1.5 billion. Major uses for specific clays were estimated to be as follows: ball clay—36% floor <strong>and</strong> walltile, 22% sanitaryware, <strong>and</strong> 42% other uses; bentonite—25% absorbents, 19% drilling mud, 17% foundry s<strong>and</strong> bond,12% iron ore pelletizing, <strong>and</strong> 27% other uses; common clay—50% brick, 25% lightweight aggregate, 16% cement,<strong>and</strong> 9% other uses; fire clay—38% heavy clay products, 62% refractory products <strong>and</strong> other uses; fuller’s earth—74%absorbent uses <strong>and</strong> 26% other uses; <strong>and</strong> kaolin—58% paper <strong>and</strong> 42% other uses.Salient Statistics—United States: 1 2006 2007 2008 2009 2010 eProduction, mine:Ball clay 1,190 1,070 967 831 910Bentonite 4,940 4,820 5,030 3,650 4,000Common clay 24,200 20,600 17,500 12,500 13,500Fire clay 848 565 447 320 270Fuller’s earth 2,540 2,6602,3502,0102,300Kaolin 7,470 7,110 6,740 5,290 5,700Total 3 41,200 36,70033,20024,50027,000Imports for consumption:Artificially activated clay <strong>and</strong> earth 21 23 25 20 18Kaolin 303 194 330 281 250Other 22 14 20 2634Total 3 346 231 375 327 300Exports:Ball clay 140 83 65 35 41Bentonite 1,270 1,430 1,090 710 960Fire clay 4 348 425 393 328 395Fuller’s earth 69 134 127 90 330Kaolin 3,540 3,300 2,960 2,290 2,600Clays, not elsewhere classified 607 279 153 374 365Total 3 5,980 5,650 4,790 3,830 4,700Consumption, apparent 35,600 31,400 28,600 21,000 23,000Price, average, dollars per ton:Ball clay 44 46 46 45 47Bentonite 48 52 49 57 59Common clay 10 11 12 13 13Fire clay 22 42 40 30 31Fuller’s earth 96 9798102107Kaolin 131 135 134 135 140Employment, number: eMine 1,250 1,150 1,060 875 770Mill 5,130 5,080 5,020 4,540 4,100Net import reliance 5 as a percentage ofapparent consumption E E E E ERecycling: Insignificant.Import Sources (2006–09): Brazil, 81%; Mexico, 6%; Canada, 4%; United Kingdom, 3%; <strong>and</strong> other, 6%.Prepared by Robert L. Virta [(703) 648-7726, rvirta@usgs.gov, fax: (703) 648-7757]
- Page 3: U.S. Department of the InteriorKEN
- Page 6 and 7: INTRODUCTION3Each chapter of the 20
- Page 8 and 9: 5NET EXPORTS OF MINERALRAW MATERIAL
- Page 10 and 11: SIGNIFICANT EVENTS, TRENDS, AND ISS
- Page 12 and 13: mineral materials valued at $1.30 b
- Page 14 and 15: 11MAJOR METAL-PRODUCING AREASAuB2P1
- Page 16 and 17: 13MAJOR INDUSTRIAL MINERAL-PRODUCIN
- Page 18 and 19: ABRASIVES (MANUFACTURED)15Events, T
- Page 20 and 21: ALUMINUM17The United States continu
- Page 22 and 23: ANTIMONY19Events, Trends, and Issue
- Page 24 and 25: ARSENIC21According to university me
- Page 26 and 27: ASBESTOS23Events, Trends, and Issue
- Page 28 and 29: BARITE25Nationally, the rig count o
- Page 30 and 31: BAUXITE AND ALUMINA27Events, Trends
- Page 32 and 33: BERYLLIUM29Events, Trends, and Issu
- Page 34 and 35: BISMUTH31Events, Trends, and Issues
- Page 36 and 37: BORON33Events, Trends, and Issues:
- Page 38 and 39: BROMINE35Events, Trends, and Issues
- Page 40 and 41: CADMIUM37NiCd battery use in consum
- Page 42 and 43: CEMENT39The manufacture of clinker
- Page 44 and 45: CESIUM41Events, Trends, and Issues:
- Page 48 and 49: CLAYS45Tariff: Item Number Normal T
- Page 50 and 51: COBALT47Events, Trends, and Issues:
- Page 52 and 53: COPPER49Events, Trends, and Issues:
- Page 54 and 55: DIAMOND (INDUSTRIAL)51Events, Trend
- Page 56 and 57: DIATOMITE53Events, Trends, and Issu
- Page 58 and 59: FELDSPAR55Feldspar use in tile and
- Page 60 and 61: FLUORSPAR57with planned output of 1
- Page 62 and 63: GALLIUM59In response to the unprece
- Page 64 and 65: GARNET (INDUSTRIAL)61Events, Trends
- Page 66 and 67: GEMSTONES63Events, Trends, and Issu
- Page 68 and 69: GERMANIUM65Events, Trends, and Issu
- Page 70 and 71: GOLD67With the increase in price of
- Page 72 and 73: GRAPHITE (NATURAL)69Events, Trends,
- Page 74 and 75: GYPSUM71Through 2010, more than 3,6
- Page 76 and 77: HELIUM73Events, Trends, and Issues:
- Page 78 and 79: INDIUM75China’s 21 indium produce
- Page 80 and 81: IODINE77Events, Trends, and Issues:
- Page 82 and 83: IRON AND STEEL79Events, Trends, and
- Page 84 and 85: IRON AND STEEL SCRAP81Tariff: Item
- Page 86 and 87: IRON AND STEEL SLAG83Events, Trends
- Page 88 and 89: IRON ORE85In 2009, China imported a
- Page 90 and 91: IRON OXIDE PIGMENTS87Events, Trends
- Page 92 and 93: KYANITE AND RELATED MATERIALS89Even
- Page 94 and 95: LEAD91caused by underground fires a
- Page 96 and 97:
LIME93The lime industry is facing p
- Page 98 and 99:
LITHIUM95market, and a facility at
- Page 100 and 101:
MAGNESIUM COMPOUNDS97In Australia,
- Page 102 and 103:
MAGNESIUM METAL99U.S. magnesium con
- Page 104 and 105:
MANGANESE101Government Stockpile:St
- Page 106 and 107:
MERCURY103Events, Trends, and Issue
- Page 108 and 109:
MICA (NATURAL)105Depletion Allowanc
- Page 110 and 111:
MOLYBDENUM107Events, Trends, and Is
- Page 112 and 113:
NICKEL109Nickel prices were adverse
- Page 114 and 115:
NIOBIUM (COLUMBIUM)111Events, Trend
- Page 116 and 117:
NITROGEN (FIXED)—AMMONIA113Accord
- Page 118 and 119:
PEAT115Events, Trends, and Issues:
- Page 120 and 121:
PERLITE117Events, Trends, and Issue
- Page 122 and 123:
PHOSPHATE ROCK119Events, Trends, an
- Page 124 and 125:
PLATINUM-GROUP METALS121Events, Tre
- Page 126 and 127:
POTASH123Events, Trends, and Issues
- Page 128 and 129:
PUMICE AND PUMICITE125Events, Trend
- Page 130 and 131:
QUARTZ CRYSTAL (INDUSTRIAL)127Event
- Page 132 and 133:
RARE EARTHS129Events, Trends, and I
- Page 134 and 135:
RHENIUM131Events, Trends, and Issue
- Page 136 and 137:
RUBIDIUM133Events, Trends, and Issu
- Page 138 and 139:
SALT135Many chefs have advocated us
- Page 140 and 141:
SAND AND GRAVEL (CONSTRUCTION)137Ev
- Page 142 and 143:
SAND AND GRAVEL (INDUSTRIAL)139The
- Page 144 and 145:
SCANDIUM141Scandium’s use in meta
- Page 146 and 147:
SELENIUM143Events, Trends, and Issu
- Page 148 and 149:
SILICON145Events, Trends, and Issue
- Page 150 and 151:
SILVER147Silver was used as a repla
- Page 152 and 153:
SODA ASH149A Wyoming soda ash produ
- Page 154 and 155:
SODIUM SULFATE151Events, Trends, an
- Page 156 and 157:
STONE (CRUSHED)153Events, Trends, a
- Page 158 and 159:
STONE (DIMENSION)155Events, Trends,
- Page 160 and 161:
STRONTIUM157Events, Trends, and Iss
- Page 162 and 163:
SULFUR159World sulfur production in
- Page 164 and 165:
TALC AND PYROPHYLLITE161Events, Tre
- Page 166 and 167:
TANTALUM163Events, Trends, and Issu
- Page 168 and 169:
TELLURIUM165Events, Trends, and Iss
- Page 170:
THALLIUM167Beginning in 2009, there
- Page 173 and 174:
170TIN(Data in metric tons of tin c
- Page 175 and 176:
172TITANIUM AND TITANIUM DIOXIDE 1(
- Page 177 and 178:
174TITANIUM MINERAL CONCENTRATES 1(
- Page 179 and 180:
176TUNGSTEN(Data in metric tons of
- Page 181 and 182:
178VANADIUM(Data in metric tons of
- Page 183 and 184:
180VERMICULITE(Data in thousand met
- Page 185 and 186:
182WOLLASTONITE(Data in metric tons
- Page 187 and 188:
184YTTRIUM 1(Data in metric tons of
- Page 189 and 190:
186ZEOLITES (NATURAL)(Data in metri
- Page 191 and 192:
188ZINC(Data in thousand metric ton
- Page 193 and 194:
190ZIRCONIUM AND HAFNIUM(Data in me
- Page 195 and 196:
192APPENDIX AAbbreviations and Unit
- Page 197 and 198:
194Demonstrated.—A term for the s
- Page 199 and 200:
196Part B—Sources of Reserves Dat
- Page 201:
198Europe and Central Eurasia—con