ANTIMONY19Events, Trends, <strong>and</strong> Issues: In 2010, antimony production from domestic source materials was derived mostly fromthe recycling of lead-acid batteries. Recycling supplied only a minor portion of estimated domestic consumption, <strong>and</strong>the remainder came from imports. In recent years, the number of primary antimony smelters has been reduced, assmelters in New Jersey <strong>and</strong> Texas were closed in 2004. Only one domestic smelter in Montana continued to makeantimony products. This domestic smelter, through its wholly owned Mexican subsidiary, received approval to build anore-processing plant near its antimony-silver deposit in Mexico. The antimony materials produced there would providefeedstock for the Montana facility.Two actions caused production reductions in China, the world’s leading antimony producer. In March, theGovernment stated it would not approve any new projects for antimony before June 30, <strong>2011</strong>; also in March, theGovernment shut down about 100 antimony smelters in China’s dominant antimony-producing region, an actionaimed at closing illegal mines <strong>and</strong> curbing pollution.The price of antimony rose substantially during 2010. The price started the year at about $2.90 per pound <strong>and</strong>finished October at about $5.25 per pound. Industry observers attributed the strong price increase to productioninterruptions in China.Several new antimony mine projects were being developed in Australia, Canada, <strong>and</strong> Laos.World Mine Production <strong>and</strong> Reserves: Reserves for China, Russia, <strong>and</strong> Thail<strong>and</strong> (in “Other countries”) werechanged based on new information from Government <strong>and</strong> other sources.Mine production Reserves 520092010 eBolivia 3,000 3,000 310,000China 140,000 120,000 950,000Russia (recoverable) 3,500 3,000 350,000South Africa 2,800 3,000 21,000Tajikistan 2,000 2,000 50,000Other countries 3,300 4,000150,000World total (rounded) 155,000 135,000 1,800,000World Resources: U.S. resources of antimony are mainly in Alaska, Idaho, Montana, <strong>and</strong> Nevada. Principalidentified world resources are in Bolivia, China, Mexico, Russia, <strong>and</strong> South Africa. Additional antimony resources mayoccur in Mississippi Valley-type lead deposits in the Eastern United States.Substitutes: Compounds of chromium, tin, titanium, zinc, <strong>and</strong> zirconium substitute for antimony chemicals in paint,pigments, <strong>and</strong> enamels. Combinations of cadmium, calcium, copper, selenium, strontium, sulfur, <strong>and</strong> tin can be usedas substitutes for hardening lead. Selected organic compounds <strong>and</strong> hydrated aluminum oxide are widely acceptedsubstitutes as flame retardants.e Estimated. W Withheld to avoid disclosing company proprietary data. — Zero.1 Gross weight, for metal, alloys, waste, <strong>and</strong> scrap.2 Domestic mine production + secondary production from old scrap + net import reliance.3 New York dealer price for 99.5% to 99.6% metal, c.i.f. U.S. ports.4 Defined as imports - exports + adjustments for Government <strong>and</strong> industry stock changes.5 See Appendix C for resource/reserve definitions <strong>and</strong> information concerning data sources.U.S. Geological Survey, <strong>Mineral</strong> <strong>Commodity</strong> <strong>Summaries</strong>, January <strong>2011</strong>
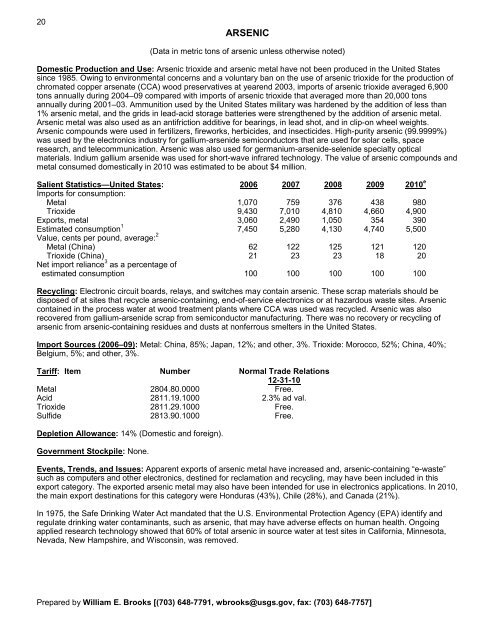
20ARSENIC(Data in metric tons of arsenic unless otherwise noted)Domestic Production <strong>and</strong> Use: Arsenic trioxide <strong>and</strong> arsenic metal have not been produced in the United Statessince 1985. Owing to environmental concerns <strong>and</strong> a voluntary ban on the use of arsenic trioxide for the production ofchromated copper arsenate (CCA) wood preservatives at yearend 2003, imports of arsenic trioxide averaged 6,900tons annually during 2004–09 compared with imports of arsenic trioxide that averaged more than 20,000 tonsannually during 2001–03. Ammunition used by the United States military was hardened by the addition of less than1% arsenic metal, <strong>and</strong> the grids in lead-acid storage batteries were strengthened by the addition of arsenic metal.Arsenic metal was also used as an antifriction additive for bearings, in lead shot, <strong>and</strong> in clip-on wheel weights.Arsenic compounds were used in fertilizers, fireworks, herbicides, <strong>and</strong> insecticides. High-purity arsenic (99.9999%)was used by the electronics industry for gallium-arsenide semiconductors that are used for solar cells, spaceresearch, <strong>and</strong> telecommunication. Arsenic was also used for germanium-arsenide-selenide specialty opticalmaterials. Indium gallium arsenide was used for short-wave infrared technology. The value of arsenic compounds <strong>and</strong>metal consumed domestically in 2010 was estimated to be about $4 million.Salient Statistics—United States: 2006 2007 2008 2009 2010 eImports for consumption:Metal 1,070 759 376 438 980Trioxide 9,430 7,010 4,810 4,660 4,900Exports, metal 3,060 2,490 1,050 354 390Estimated consumption 1 7,450 5,280 4,130 4,740 5,500Value, cents per pound, average: 2Metal (China) 62 122 125 121 120Trioxide (China) 21 23 23 18 20Net import reliance 3 as a percentage ofestimated consumption 100 100 100 100 100Recycling: Electronic circuit boards, relays, <strong>and</strong> switches may contain arsenic. These scrap materials should bedisposed of at sites that recycle arsenic-containing, end-of-service electronics or at hazardous waste sites. Arseniccontained in the process water at wood treatment plants where CCA was used was recycled. Arsenic was alsorecovered from gallium-arsenide scrap from semiconductor manufacturing. There was no recovery or recycling ofarsenic from arsenic-containing residues <strong>and</strong> dusts at nonferrous smelters in the United States.Import Sources (2006–09): Metal: China, 85%; Japan, 12%; <strong>and</strong> other, 3%. Trioxide: Morocco, 52%; China, 40%;Belgium, 5%; <strong>and</strong> other, 3%.Tariff: Item Number Normal Trade Relations12-31-10Metal 2804.80.0000 Free.Acid 2811.19.1000 2.3% ad val.Trioxide 2811.29.1000 Free.Sulfide 2813.90.1000 Free.Depletion Allowance: 14% (Domestic <strong>and</strong> foreign).Government Stockpile: None.Events, Trends, <strong>and</strong> Issues: Apparent exports of arsenic metal have increased <strong>and</strong>, arsenic-containing “e-waste”such as computers <strong>and</strong> other electronics, destined for reclamation <strong>and</strong> recycling, may have been included in thisexport category. The exported arsenic metal may also have been intended for use in electronics applications. In 2010,the main export destinations for this category were Honduras (43%), Chile (28%), <strong>and</strong> Canada (21%).In 1975, the Safe Drinking Water Act m<strong>and</strong>ated that the U.S. <strong>Environmental</strong> Protection Agency (EPA) identify <strong>and</strong>regulate drinking water contaminants, such as arsenic, that may have adverse effects on human health. Ongoingapplied research technology showed that 60% of total arsenic in source water at test sites in California, Minnesota,Nevada, New Hampshire, <strong>and</strong> Wisconsin, was removed.Prepared by William E. Brooks [(703) 648-7791, wbrooks@usgs.gov, fax: (703) 648-7757]
- Page 3: U.S. Department of the InteriorKEN
- Page 6 and 7: INTRODUCTION3Each chapter of the 20
- Page 8 and 9: 5NET EXPORTS OF MINERALRAW MATERIAL
- Page 10 and 11: SIGNIFICANT EVENTS, TRENDS, AND ISS
- Page 12 and 13: mineral materials valued at $1.30 b
- Page 14 and 15: 11MAJOR METAL-PRODUCING AREASAuB2P1
- Page 16 and 17: 13MAJOR INDUSTRIAL MINERAL-PRODUCIN
- Page 18 and 19: ABRASIVES (MANUFACTURED)15Events, T
- Page 20 and 21: ALUMINUM17The United States continu
- Page 24 and 25: ARSENIC21According to university me
- Page 26 and 27: ASBESTOS23Events, Trends, and Issue
- Page 28 and 29: BARITE25Nationally, the rig count o
- Page 30 and 31: BAUXITE AND ALUMINA27Events, Trends
- Page 32 and 33: BERYLLIUM29Events, Trends, and Issu
- Page 34 and 35: BISMUTH31Events, Trends, and Issues
- Page 36 and 37: BORON33Events, Trends, and Issues:
- Page 38 and 39: BROMINE35Events, Trends, and Issues
- Page 40 and 41: CADMIUM37NiCd battery use in consum
- Page 42 and 43: CEMENT39The manufacture of clinker
- Page 44 and 45: CESIUM41Events, Trends, and Issues:
- Page 46 and 47: CHROMIUM43Stockpile Status—9-30-1
- Page 48 and 49: CLAYS45Tariff: Item Number Normal T
- Page 50 and 51: COBALT47Events, Trends, and Issues:
- Page 52 and 53: COPPER49Events, Trends, and Issues:
- Page 54 and 55: DIAMOND (INDUSTRIAL)51Events, Trend
- Page 56 and 57: DIATOMITE53Events, Trends, and Issu
- Page 58 and 59: FELDSPAR55Feldspar use in tile and
- Page 60 and 61: FLUORSPAR57with planned output of 1
- Page 62 and 63: GALLIUM59In response to the unprece
- Page 64 and 65: GARNET (INDUSTRIAL)61Events, Trends
- Page 66 and 67: GEMSTONES63Events, Trends, and Issu
- Page 68 and 69: GERMANIUM65Events, Trends, and Issu
- Page 70 and 71: GOLD67With the increase in price of
- Page 72 and 73:
GRAPHITE (NATURAL)69Events, Trends,
- Page 74 and 75:
GYPSUM71Through 2010, more than 3,6
- Page 76 and 77:
HELIUM73Events, Trends, and Issues:
- Page 78 and 79:
INDIUM75China’s 21 indium produce
- Page 80 and 81:
IODINE77Events, Trends, and Issues:
- Page 82 and 83:
IRON AND STEEL79Events, Trends, and
- Page 84 and 85:
IRON AND STEEL SCRAP81Tariff: Item
- Page 86 and 87:
IRON AND STEEL SLAG83Events, Trends
- Page 88 and 89:
IRON ORE85In 2009, China imported a
- Page 90 and 91:
IRON OXIDE PIGMENTS87Events, Trends
- Page 92 and 93:
KYANITE AND RELATED MATERIALS89Even
- Page 94 and 95:
LEAD91caused by underground fires a
- Page 96 and 97:
LIME93The lime industry is facing p
- Page 98 and 99:
LITHIUM95market, and a facility at
- Page 100 and 101:
MAGNESIUM COMPOUNDS97In Australia,
- Page 102 and 103:
MAGNESIUM METAL99U.S. magnesium con
- Page 104 and 105:
MANGANESE101Government Stockpile:St
- Page 106 and 107:
MERCURY103Events, Trends, and Issue
- Page 108 and 109:
MICA (NATURAL)105Depletion Allowanc
- Page 110 and 111:
MOLYBDENUM107Events, Trends, and Is
- Page 112 and 113:
NICKEL109Nickel prices were adverse
- Page 114 and 115:
NIOBIUM (COLUMBIUM)111Events, Trend
- Page 116 and 117:
NITROGEN (FIXED)—AMMONIA113Accord
- Page 118 and 119:
PEAT115Events, Trends, and Issues:
- Page 120 and 121:
PERLITE117Events, Trends, and Issue
- Page 122 and 123:
PHOSPHATE ROCK119Events, Trends, an
- Page 124 and 125:
PLATINUM-GROUP METALS121Events, Tre
- Page 126 and 127:
POTASH123Events, Trends, and Issues
- Page 128 and 129:
PUMICE AND PUMICITE125Events, Trend
- Page 130 and 131:
QUARTZ CRYSTAL (INDUSTRIAL)127Event
- Page 132 and 133:
RARE EARTHS129Events, Trends, and I
- Page 134 and 135:
RHENIUM131Events, Trends, and Issue
- Page 136 and 137:
RUBIDIUM133Events, Trends, and Issu
- Page 138 and 139:
SALT135Many chefs have advocated us
- Page 140 and 141:
SAND AND GRAVEL (CONSTRUCTION)137Ev
- Page 142 and 143:
SAND AND GRAVEL (INDUSTRIAL)139The
- Page 144 and 145:
SCANDIUM141Scandium’s use in meta
- Page 146 and 147:
SELENIUM143Events, Trends, and Issu
- Page 148 and 149:
SILICON145Events, Trends, and Issue
- Page 150 and 151:
SILVER147Silver was used as a repla
- Page 152 and 153:
SODA ASH149A Wyoming soda ash produ
- Page 154 and 155:
SODIUM SULFATE151Events, Trends, an
- Page 156 and 157:
STONE (CRUSHED)153Events, Trends, a
- Page 158 and 159:
STONE (DIMENSION)155Events, Trends,
- Page 160 and 161:
STRONTIUM157Events, Trends, and Iss
- Page 162 and 163:
SULFUR159World sulfur production in
- Page 164 and 165:
TALC AND PYROPHYLLITE161Events, Tre
- Page 166 and 167:
TANTALUM163Events, Trends, and Issu
- Page 168 and 169:
TELLURIUM165Events, Trends, and Iss
- Page 170:
THALLIUM167Beginning in 2009, there
- Page 173 and 174:
170TIN(Data in metric tons of tin c
- Page 175 and 176:
172TITANIUM AND TITANIUM DIOXIDE 1(
- Page 177 and 178:
174TITANIUM MINERAL CONCENTRATES 1(
- Page 179 and 180:
176TUNGSTEN(Data in metric tons of
- Page 181 and 182:
178VANADIUM(Data in metric tons of
- Page 183 and 184:
180VERMICULITE(Data in thousand met
- Page 185 and 186:
182WOLLASTONITE(Data in metric tons
- Page 187 and 188:
184YTTRIUM 1(Data in metric tons of
- Page 189 and 190:
186ZEOLITES (NATURAL)(Data in metri
- Page 191 and 192:
188ZINC(Data in thousand metric ton
- Page 193 and 194:
190ZIRCONIUM AND HAFNIUM(Data in me
- Page 195 and 196:
192APPENDIX AAbbreviations and Unit
- Page 197 and 198:
194Demonstrated.—A term for the s
- Page 199 and 200:
196Part B—Sources of Reserves Dat
- Page 201:
198Europe and Central Eurasia—con