Mineral Commodity Summaries 2011 - Environmental and Energy ...
Mineral Commodity Summaries 2011 - Environmental and Energy ...
Mineral Commodity Summaries 2011 - Environmental and Energy ...
You also want an ePaper? Increase the reach of your titles
YUMPU automatically turns print PDFs into web optimized ePapers that Google loves.
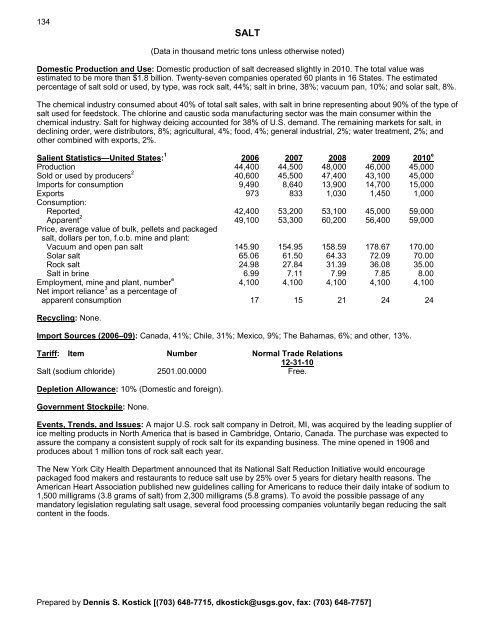
134SALT(Data in thous<strong>and</strong> metric tons unless otherwise noted)Domestic Production <strong>and</strong> Use: Domestic production of salt decreased slightly in 2010. The total value wasestimated to be more than $1.8 billion. Twenty-seven companies operated 60 plants in 16 States. The estimatedpercentage of salt sold or used, by type, was rock salt, 44%; salt in brine, 38%; vacuum pan, 10%; <strong>and</strong> solar salt, 8%.The chemical industry consumed about 40% of total salt sales, with salt in brine representing about 90% of the type ofsalt used for feedstock. The chlorine <strong>and</strong> caustic soda manufacturing sector was the main consumer within thechemical industry. Salt for highway deicing accounted for 38% of U.S. dem<strong>and</strong>. The remaining markets for salt, indeclining order, were distributors, 8%; agricultural, 4%; food, 4%; general industrial, 2%; water treatment, 2%; <strong>and</strong>other combined with exports, 2%.Salient Statistics—United States: 1 2006 2007 2008 2009 2010 eProduction 44,400 44,500 48,000 46,000 45,000Sold or used by producers 2 40,600 45,500 47,400 43,100 45,000Imports for consumption 9,490 8,640 13,900 14,700 15,000Exports 973 833 1,030 1,450 1,000Consumption:Reported 42,400 53,200 53,100 45,000 59,000Apparent 2 49,100 53,300 60,200 56,400 59,000Price, average value of bulk, pellets <strong>and</strong> packagedsalt, dollars per ton, f.o.b. mine <strong>and</strong> plant:Vacuum <strong>and</strong> open pan salt 145.90 154.95 158.59 178.67 170.00Solar salt 65.06 61.50 64.33 72.09 70.00Rock salt 24.98 27.84 31.39 36.08 35.00Salt in brine 6.99 7.11 7.99 7.85 8.00Employment, mine <strong>and</strong> plant, number e 4,100 4,100 4,100 4,100 4,100Net import reliance 3 as a percentage ofapparent consumption 17 15 21 24 24Recycling: None.Import Sources (2006–09): Canada, 41%; Chile, 31%; Mexico, 9%; The Bahamas, 6%; <strong>and</strong> other, 13%.Tariff: Item Number Normal Trade Relations12-31-10Salt (sodium chloride) 2501.00.0000 Free.Depletion Allowance: 10% (Domestic <strong>and</strong> foreign).Government Stockpile: None.Events, Trends, <strong>and</strong> Issues: A major U.S. rock salt company in Detroit, MI, was acquired by the leading supplier ofice melting products in North America that is based in Cambridge, Ontario, Canada. The purchase was expected toassure the company a consistent supply of rock salt for its exp<strong>and</strong>ing business. The mine opened in 1906 <strong>and</strong>produces about 1 million tons of rock salt each year.The New York City Health Department announced that its National Salt Reduction Initiative would encouragepackaged food makers <strong>and</strong> restaurants to reduce salt use by 25% over 5 years for dietary health reasons. TheAmerican Heart Association published new guidelines calling for Americans to reduce their daily intake of sodium to1,500 milligrams (3.8 grams of salt) from 2,300 milligrams (5.8 grams). To avoid the possible passage of anym<strong>and</strong>atory legislation regulating salt usage, several food processing companies voluntarily began reducing the saltcontent in the foods.Prepared by Dennis S. Kostick [(703) 648-7715, dkostick@usgs.gov, fax: (703) 648-7757]


