SODA ASH149A Wyoming soda ash producer with seven synthetic soda ash plants in Europe withdrew from the U.S. exportassociation effective after December 31, 2010. The company indicated that it was fully capable to logistically <strong>and</strong>technically serve its worldwide customers. This was the second soda ash company to leave the association since itsformation in 1984.Operators of the natural soda ash facility at Beypazari, Turkey, which came onstream in 2009, announced plans todouble production capacity by early 2013. The plant was designed to produce one million tons of soda ash annuallyfrom underground trona beds. Production costs were estimated to be 30% to 40% lower than the Solvay syntheticsoda ash process.The adverse economic conditions throughout most of the world are forecast to improve beginning in <strong>2011</strong>.Notwithst<strong>and</strong>ing the continuing economic <strong>and</strong> energy problems in certain areas of the world, overall global dem<strong>and</strong>for soda ash is expected to grow from 1.5% to 2% annually for the next several years. If the domestic economy <strong>and</strong>export sales improve, U.S. consumption may be higher in <strong>2011</strong>.World Production <strong>and</strong> Reserves:Production Reserves 4, 5Natural: 2009 2010 eUnited States 9,310 10,0006 23,000,000Botswana 250 250 400,000Kenya 405 450 7,000Mexico — — 200,000Turkey 1,000 1,000 200,000Ug<strong>and</strong>a NA NA 20,000Other countries — —260,000World total, natural (rounded) 11,100 11,700 24,000,000World total, synthetic (rounded) 33,000 34,300 XXWorld total (rounded) 44,000 46,000 XXWorld Resources: Soda ash is obtained from trona <strong>and</strong> sodium carbonate-rich brines. The world’s largest deposit oftrona is in the Green River Basin of Wyoming. About 47 billion tons of identified soda ash resources could berecovered from the 56 billion tons of bedded trona <strong>and</strong> the 47 billion tons of interbedded or intermixed trona <strong>and</strong> halitethat are in beds more than 1.2 meters thick. Underground room-<strong>and</strong>-pillar mining, using conventional <strong>and</strong> continuousmining, is the primary method of mining Wyoming trona ore. This method has an average 45% mining recovery,whereas average recovery from solution mining is 30%. Improved solution-mining techniques, such as horizontaldrilling to establish communication between well pairs, could increase this extraction rate <strong>and</strong> entice companies todevelop some of the deeper trona beds. Wyoming trona resources are being depleted at the rate of about 15 milliontons per year (8.3 million tons of soda ash). Searles Lake <strong>and</strong> Owens Lake in California contain an estimated 815million tons of soda ash reserves. There are at least 62 identified natural sodium carbonate deposits in the world, onlysome of which have been quantified. Although soda ash can be manufactured from salt <strong>and</strong> limestone, both of whichare practically inexhaustible, synthetic soda ash is more costly to produce <strong>and</strong> generates environmentally deleteriouswastes.Substitutes: Caustic soda can be substituted for soda ash in certain uses, particularly in the pulp <strong>and</strong> paper, watertreatment, <strong>and</strong> certain chemical sectors. Soda ash, soda liquors, or trona can be used as feedstock to manufacturechemical caustic soda, which is an alternative to electrolytic caustic soda.e Estimated. E Net exporter. NA Not available. XX Not applicable. — Zero.1 Does not include values for soda liquors <strong>and</strong> mine waters.2 Natural only.3 Defined as imports – exports + adjustments for Government <strong>and</strong> industry stock changes.4 The reported quantities are sodium carbonate only. About 1.8 tons of trona yields 1 ton of sodium carbonate.5 See Appendix C for resource/reserve definitions <strong>and</strong> information concerning data sources.6 From trona, nahcolite, <strong>and</strong> dawsonite sources.U.S. Geological Survey, <strong>Mineral</strong> <strong>Commodity</strong> <strong>Summaries</strong>, January <strong>2011</strong>
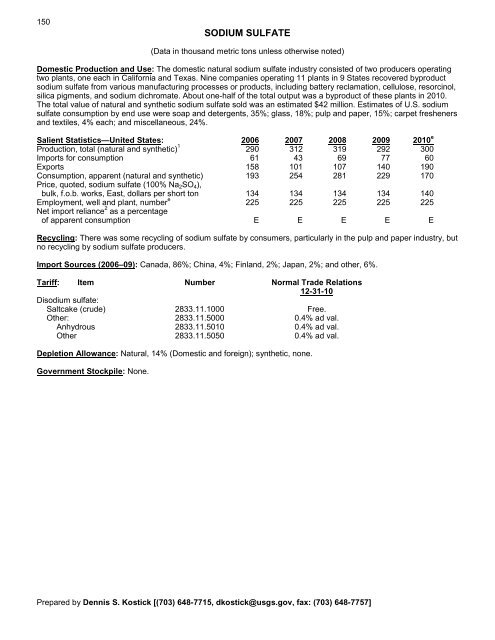
150SODIUM SULFATE(Data in thous<strong>and</strong> metric tons unless otherwise noted)Domestic Production <strong>and</strong> Use: The domestic natural sodium sulfate industry consisted of two producers operatingtwo plants, one each in California <strong>and</strong> Texas. Nine companies operating 11 plants in 9 States recovered byproductsodium sulfate from various manufacturing processes or products, including battery reclamation, cellulose, resorcinol,silica pigments, <strong>and</strong> sodium dichromate. About one-half of the total output was a byproduct of these plants in 2010.The total value of natural <strong>and</strong> synthetic sodium sulfate sold was an estimated $42 million. Estimates of U.S. sodiumsulfate consumption by end use were soap <strong>and</strong> detergents, 35%; glass, 18%; pulp <strong>and</strong> paper, 15%; carpet fresheners<strong>and</strong> textiles, 4% each; <strong>and</strong> miscellaneous, 24%.Salient Statistics—United States: 2006 2007 2008 2009 2010 eProduction, total (natural <strong>and</strong> synthetic) 1 290 312 319 292 300Imports for consumption 61 43 69 77 60Exports 158 101 107 140 190Consumption, apparent (natural <strong>and</strong> synthetic) 193 254 281 229 170Price, quoted, sodium sulfate (100% Na 2 SO 4 ),bulk, f.o.b. works, East, dollars per short ton 134 134 134 134 140Employment, well <strong>and</strong> plant, number e 225 225 225 225 225Net import reliance 2 as a percentageof apparent consumption E E E E ERecycling: There was some recycling of sodium sulfate by consumers, particularly in the pulp <strong>and</strong> paper industry, butno recycling by sodium sulfate producers.Import Sources (2006–09): Canada, 86%; China, 4%; Finl<strong>and</strong>, 2%; Japan, 2%; <strong>and</strong> other, 6%.Tariff: Item Number Normal Trade Relations12-31-10Disodium sulfate:Saltcake (crude) 2833.11.1000 Free.Other: 2833.11.5000 0.4% ad val.Anhydrous 2833.11.5010 0.4% ad val.Other 2833.11.5050 0.4% ad val.Depletion Allowance: Natural, 14% (Domestic <strong>and</strong> foreign); synthetic, none.Government Stockpile: None.Prepared by Dennis S. Kostick [(703) 648-7715, dkostick@usgs.gov, fax: (703) 648-7757]
- Page 3:
U.S. Department of the InteriorKEN
- Page 6 and 7:
INTRODUCTION3Each chapter of the 20
- Page 8 and 9:
5NET EXPORTS OF MINERALRAW MATERIAL
- Page 10 and 11:
SIGNIFICANT EVENTS, TRENDS, AND ISS
- Page 12 and 13:
mineral materials valued at $1.30 b
- Page 14 and 15:
11MAJOR METAL-PRODUCING AREASAuB2P1
- Page 16 and 17:
13MAJOR INDUSTRIAL MINERAL-PRODUCIN
- Page 18 and 19:
ABRASIVES (MANUFACTURED)15Events, T
- Page 20 and 21:
ALUMINUM17The United States continu
- Page 22 and 23:
ANTIMONY19Events, Trends, and Issue
- Page 24 and 25:
ARSENIC21According to university me
- Page 26 and 27:
ASBESTOS23Events, Trends, and Issue
- Page 28 and 29:
BARITE25Nationally, the rig count o
- Page 30 and 31:
BAUXITE AND ALUMINA27Events, Trends
- Page 32 and 33:
BERYLLIUM29Events, Trends, and Issu
- Page 34 and 35:
BISMUTH31Events, Trends, and Issues
- Page 36 and 37:
BORON33Events, Trends, and Issues:
- Page 38 and 39:
BROMINE35Events, Trends, and Issues
- Page 40 and 41:
CADMIUM37NiCd battery use in consum
- Page 42 and 43:
CEMENT39The manufacture of clinker
- Page 44 and 45:
CESIUM41Events, Trends, and Issues:
- Page 46 and 47:
CHROMIUM43Stockpile Status—9-30-1
- Page 48 and 49:
CLAYS45Tariff: Item Number Normal T
- Page 50 and 51:
COBALT47Events, Trends, and Issues:
- Page 52 and 53:
COPPER49Events, Trends, and Issues:
- Page 54 and 55:
DIAMOND (INDUSTRIAL)51Events, Trend
- Page 56 and 57:
DIATOMITE53Events, Trends, and Issu
- Page 58 and 59:
FELDSPAR55Feldspar use in tile and
- Page 60 and 61:
FLUORSPAR57with planned output of 1
- Page 62 and 63:
GALLIUM59In response to the unprece
- Page 64 and 65:
GARNET (INDUSTRIAL)61Events, Trends
- Page 66 and 67:
GEMSTONES63Events, Trends, and Issu
- Page 68 and 69:
GERMANIUM65Events, Trends, and Issu
- Page 70 and 71:
GOLD67With the increase in price of
- Page 72 and 73:
GRAPHITE (NATURAL)69Events, Trends,
- Page 74 and 75:
GYPSUM71Through 2010, more than 3,6
- Page 76 and 77:
HELIUM73Events, Trends, and Issues:
- Page 78 and 79:
INDIUM75China’s 21 indium produce
- Page 80 and 81:
IODINE77Events, Trends, and Issues:
- Page 82 and 83:
IRON AND STEEL79Events, Trends, and
- Page 84 and 85:
IRON AND STEEL SCRAP81Tariff: Item
- Page 86 and 87:
IRON AND STEEL SLAG83Events, Trends
- Page 88 and 89:
IRON ORE85In 2009, China imported a
- Page 90 and 91:
IRON OXIDE PIGMENTS87Events, Trends
- Page 92 and 93:
KYANITE AND RELATED MATERIALS89Even
- Page 94 and 95:
LEAD91caused by underground fires a
- Page 96 and 97:
LIME93The lime industry is facing p
- Page 98 and 99:
LITHIUM95market, and a facility at
- Page 100 and 101:
MAGNESIUM COMPOUNDS97In Australia,
- Page 102 and 103: MAGNESIUM METAL99U.S. magnesium con
- Page 104 and 105: MANGANESE101Government Stockpile:St
- Page 106 and 107: MERCURY103Events, Trends, and Issue
- Page 108 and 109: MICA (NATURAL)105Depletion Allowanc
- Page 110 and 111: MOLYBDENUM107Events, Trends, and Is
- Page 112 and 113: NICKEL109Nickel prices were adverse
- Page 114 and 115: NIOBIUM (COLUMBIUM)111Events, Trend
- Page 116 and 117: NITROGEN (FIXED)—AMMONIA113Accord
- Page 118 and 119: PEAT115Events, Trends, and Issues:
- Page 120 and 121: PERLITE117Events, Trends, and Issue
- Page 122 and 123: PHOSPHATE ROCK119Events, Trends, an
- Page 124 and 125: PLATINUM-GROUP METALS121Events, Tre
- Page 126 and 127: POTASH123Events, Trends, and Issues
- Page 128 and 129: PUMICE AND PUMICITE125Events, Trend
- Page 130 and 131: QUARTZ CRYSTAL (INDUSTRIAL)127Event
- Page 132 and 133: RARE EARTHS129Events, Trends, and I
- Page 134 and 135: RHENIUM131Events, Trends, and Issue
- Page 136 and 137: RUBIDIUM133Events, Trends, and Issu
- Page 138 and 139: SALT135Many chefs have advocated us
- Page 140 and 141: SAND AND GRAVEL (CONSTRUCTION)137Ev
- Page 142 and 143: SAND AND GRAVEL (INDUSTRIAL)139The
- Page 144 and 145: SCANDIUM141Scandium’s use in meta
- Page 146 and 147: SELENIUM143Events, Trends, and Issu
- Page 148 and 149: SILICON145Events, Trends, and Issue
- Page 150 and 151: SILVER147Silver was used as a repla
- Page 154 and 155: SODIUM SULFATE151Events, Trends, an
- Page 156 and 157: STONE (CRUSHED)153Events, Trends, a
- Page 158 and 159: STONE (DIMENSION)155Events, Trends,
- Page 160 and 161: STRONTIUM157Events, Trends, and Iss
- Page 162 and 163: SULFUR159World sulfur production in
- Page 164 and 165: TALC AND PYROPHYLLITE161Events, Tre
- Page 166 and 167: TANTALUM163Events, Trends, and Issu
- Page 168 and 169: TELLURIUM165Events, Trends, and Iss
- Page 170: THALLIUM167Beginning in 2009, there
- Page 173 and 174: 170TIN(Data in metric tons of tin c
- Page 175 and 176: 172TITANIUM AND TITANIUM DIOXIDE 1(
- Page 177 and 178: 174TITANIUM MINERAL CONCENTRATES 1(
- Page 179 and 180: 176TUNGSTEN(Data in metric tons of
- Page 181 and 182: 178VANADIUM(Data in metric tons of
- Page 183 and 184: 180VERMICULITE(Data in thousand met
- Page 185 and 186: 182WOLLASTONITE(Data in metric tons
- Page 187 and 188: 184YTTRIUM 1(Data in metric tons of
- Page 189 and 190: 186ZEOLITES (NATURAL)(Data in metri
- Page 191 and 192: 188ZINC(Data in thousand metric ton
- Page 193 and 194: 190ZIRCONIUM AND HAFNIUM(Data in me
- Page 195 and 196: 192APPENDIX AAbbreviations and Unit
- Page 197 and 198: 194Demonstrated.—A term for the s
- Page 199 and 200: 196Part B—Sources of Reserves Dat
- Page 201: 198Europe and Central Eurasia—con