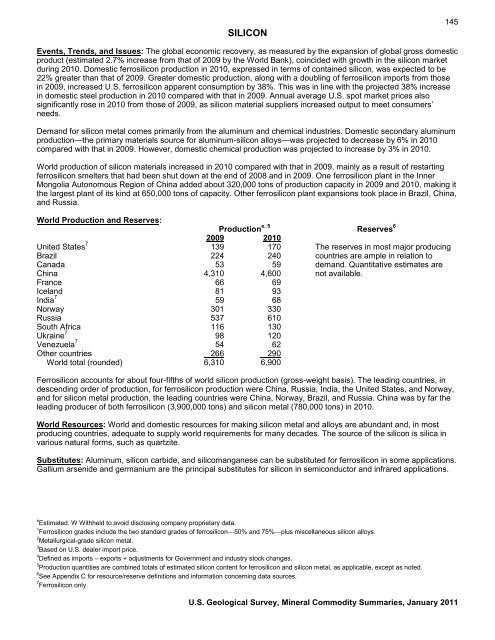
SILICON145Events, Trends, <strong>and</strong> Issues: The global economic recovery, as measured by the expansion of global gross domesticproduct (estimated 2.7% increase from that of 2009 by the World Bank), coincided with growth in the silicon marketduring 2010. Domestic ferrosilicon production in 2010, expressed in terms of contained silicon, was expected to be22% greater than that of 2009. Greater domestic production, along with a doubling of ferrosilicon imports from thosein 2009, increased U.S. ferrosilicon apparent consumption by 38%. This was in line with the projected 38% increasein domestic steel production in 2010 compared with that in 2009. Annual average U.S. spot market prices alsosignificantly rose in 2010 from those of 2009, as silicon material suppliers increased output to meet consumers’needs.Dem<strong>and</strong> for silicon metal comes primarily from the aluminum <strong>and</strong> chemical industries. Domestic secondary aluminumproduction—the primary materials source for aluminum-silicon alloys—was projected to decrease by 6% in 2010compared with that in 2009. However, domestic chemical production was projected to increase by 3% in 2010.World production of silicon materials increased in 2010 compared with that in 2009, mainly as a result of restartingferrosilicon smelters that had been shut down at the end of 2008 <strong>and</strong> in 2009. One ferrosilicon plant in the InnerMongolia Autonomous Region of China added about 320,000 tons of production capacity in 2009 <strong>and</strong> 2010, making itthe largest plant of its kind at 650,000 tons of capacity. Other ferrosilicon plant expansions took place in Brazil, China,<strong>and</strong> Russia.World Production <strong>and</strong> Reserves:Production e, 5 Reserves 62009 2010United States 7 139 170 The reserves in most major producingBrazil 224 240 countries are ample in relation toCanada 53 59 dem<strong>and</strong>. Quantitative estimates areChina 4,310 4,600 not available.France 66 69Icel<strong>and</strong> 81 93India 7 59 68Norway 301 330Russia 537 610South Africa 116 130Ukraine 7 98 120Venezuela 7 54 62Other countries 266290World total (rounded) 6,310 6,900Ferrosilicon accounts for about four-fifths of world silicon production (gross-weight basis). The leading countries, indescending order of production, for ferrosilicon production were China, Russia, India, the United States, <strong>and</strong> Norway,<strong>and</strong> for silicon metal production, the leading countries were China, Norway, Brazil, <strong>and</strong> Russia. China was by far theleading producer of both ferrosilicon (3,900,000 tons) <strong>and</strong> silicon metal (780,000 tons) in 2010.World Resources: World <strong>and</strong> domestic resources for making silicon metal <strong>and</strong> alloys are abundant <strong>and</strong>, in mostproducing countries, adequate to supply world requirements for many decades. The source of the silicon is silica invarious natural forms, such as quartzite.Substitutes: Aluminum, silicon carbide, <strong>and</strong> silicomanganese can be substituted for ferrosilicon in some applications.Gallium arsenide <strong>and</strong> germanium are the principal substitutes for silicon in semiconductor <strong>and</strong> infrared applications.e Estimated. W Withheld to avoid disclosing company proprietary data.1 Ferrosilicon grades include the two st<strong>and</strong>ard grades of ferrosilicon⎯50% <strong>and</strong> 75%⎯plus miscellaneous silicon alloys.2 Metallurgical-grade silicon metal.3 Based on U.S. dealer import price.4 Defined as imports – exports + adjustments for Government <strong>and</strong> industry stock changes.5 Production quantities are combined totals of estimated silicon content for ferrosilicon <strong>and</strong> silicon metal, as applicable, except as noted.6 See Appendix C for resource/reserve definitions <strong>and</strong> information concerning data sources.7 Ferrosilicon only.U.S. Geological Survey, <strong>Mineral</strong> <strong>Commodity</strong> <strong>Summaries</strong>, January <strong>2011</strong>
146SILVER(Data in metric tons 1 of silver content unless otherwise noted)Domestic Production <strong>and</strong> Use: In 2010, the United States produced approximately 1,280 tons of silver with anestimated value of $728 million. Silver was produced as a byproduct from 35 domestic base- <strong>and</strong> precious-metalmines. Alaska continued as the country’s leading silver-producing State, followed by Nevada; however, companyproduction data are proprietary <strong>and</strong> were withheld. There were 21 refiners of commercial-grade silver, with anestimated total output of 4,750 tons from domestic <strong>and</strong> foreign ores <strong>and</strong> concentrates, <strong>and</strong> from old <strong>and</strong> new scrap.Silver’s traditional use categories include coins <strong>and</strong> medals, industrial applications, jewelry <strong>and</strong> silverware, <strong>and</strong>photography. The physical properties of silver include ductility, electrical conductivity, malleability, <strong>and</strong> reflectivity. Thedem<strong>and</strong> for silver in industrial applications continues to increase <strong>and</strong> includes use of silver in b<strong>and</strong>ages for woundcare, batteries, brazing <strong>and</strong> soldering, in catalytic converters in automobiles, in cell phone covers to reduce thespread of bacteria, in clothing to minimize odor, electronics <strong>and</strong> circuit boards, electroplating, hardening bearings,inks, mirrors, solar cells, water purification, <strong>and</strong> wood treatment to resist mold. Silver was used for miniature antennasin Radio Frequency Identification Devices (RFIDs) that were used in casino chips, freeway toll transponders, gasolinespeed purchase devices, passports, <strong>and</strong> on packages to keep track of inventory shipments. Mercury <strong>and</strong> silver, themain components of dental amalgam, are biocides, <strong>and</strong> their use in amalgam inhibits recurrent decay.Salient Statistics—United States: 2006 2007 2008 2009 2010 eProduction:Mine 1,160 1,280 1,250 1,250 1,280Refinery:Primary 2,210 791 779 796 800Secondary (new <strong>and</strong> old scrap) 1,110 1,220 1,530 1,340 1,600Imports for consumption 2 4,840 5,000 4,680 3,590 3,840Exports 2 1,670 797 685 478 600Consumption, apparent e 5,130 5,380 6,150 5,360 5,850Price, dollars per troy ounce 3 11.61 13.43 15.02 14.69 17.75Stocks, yearend:Treasury Department 4 220 220 220 220 220COMEX, NYSE Liffe 5 3,540 4,200 3,900 3,550 3,000Exchange Traded Fund 6 3,770 5,350 8,240 12,400 16,000Employment, mine <strong>and</strong> mill, 7 number 900 900 900 900 850Net import reliance 8 as a percentageof apparent consumption e 67 66 70 64 65Recycling: In 2010, approximately 1,600 tons of silver was recovered from old <strong>and</strong> new scrap. This includes 60 to 90tons of silver that is reclaimed <strong>and</strong> recycled annually from photographic wastewater.Import Sources (2006–09): 2 Mexico, 56%; Canada, 24%; Peru, 13%; Chile, 4%; <strong>and</strong> other, 3%.Tariff: No duties are imposed on imports of unrefined silver or refined bullion.Depletion Allowance: 15% (Domestic), 14% (Foreign).Government Stockpile: None.Events, Trends, <strong>and</strong> Issues: Through mid-year 2010, silver prices averaged $17.75 per troy ounce. The overall risein silver prices corresponded to continued investment interest <strong>and</strong> holdings in new silver exchange traded funds(ETF) that have opened since the first silver ETF was established in April 2006. Silver ETF inventories totaled 15,240tons through the end of November.Industrial dem<strong>and</strong> for silver continued to decline, <strong>and</strong> in the United States, dem<strong>and</strong> for silver in photography fell toslightly more than 160 tons, compared with a high of 190 tons in 2000. Although silver is still used in x-ray films, manyhospitals have begun to use digital imaging systems. Approximately 99% of the silver in photographic wastewatermay be recycled. Silver dem<strong>and</strong> for use in coins, electronics, industrial applications, <strong>and</strong> jewelry increased, whilephotographic <strong>and</strong> silverware applications declined.Prepared by William E. Brooks [(703) 648-7791, wbrooks@usgs.gov, fax: (703) 648-7757]
- Page 3:
U.S. Department of the InteriorKEN
- Page 6 and 7:
INTRODUCTION3Each chapter of the 20
- Page 8 and 9:
5NET EXPORTS OF MINERALRAW MATERIAL
- Page 10 and 11:
SIGNIFICANT EVENTS, TRENDS, AND ISS
- Page 12 and 13:
mineral materials valued at $1.30 b
- Page 14 and 15:
11MAJOR METAL-PRODUCING AREASAuB2P1
- Page 16 and 17:
13MAJOR INDUSTRIAL MINERAL-PRODUCIN
- Page 18 and 19:
ABRASIVES (MANUFACTURED)15Events, T
- Page 20 and 21:
ALUMINUM17The United States continu
- Page 22 and 23:
ANTIMONY19Events, Trends, and Issue
- Page 24 and 25:
ARSENIC21According to university me
- Page 26 and 27:
ASBESTOS23Events, Trends, and Issue
- Page 28 and 29:
BARITE25Nationally, the rig count o
- Page 30 and 31:
BAUXITE AND ALUMINA27Events, Trends
- Page 32 and 33:
BERYLLIUM29Events, Trends, and Issu
- Page 34 and 35:
BISMUTH31Events, Trends, and Issues
- Page 36 and 37:
BORON33Events, Trends, and Issues:
- Page 38 and 39:
BROMINE35Events, Trends, and Issues
- Page 40 and 41:
CADMIUM37NiCd battery use in consum
- Page 42 and 43:
CEMENT39The manufacture of clinker
- Page 44 and 45:
CESIUM41Events, Trends, and Issues:
- Page 46 and 47:
CHROMIUM43Stockpile Status—9-30-1
- Page 48 and 49:
CLAYS45Tariff: Item Number Normal T
- Page 50 and 51:
COBALT47Events, Trends, and Issues:
- Page 52 and 53:
COPPER49Events, Trends, and Issues:
- Page 54 and 55:
DIAMOND (INDUSTRIAL)51Events, Trend
- Page 56 and 57:
DIATOMITE53Events, Trends, and Issu
- Page 58 and 59:
FELDSPAR55Feldspar use in tile and
- Page 60 and 61:
FLUORSPAR57with planned output of 1
- Page 62 and 63:
GALLIUM59In response to the unprece
- Page 64 and 65:
GARNET (INDUSTRIAL)61Events, Trends
- Page 66 and 67:
GEMSTONES63Events, Trends, and Issu
- Page 68 and 69:
GERMANIUM65Events, Trends, and Issu
- Page 70 and 71:
GOLD67With the increase in price of
- Page 72 and 73:
GRAPHITE (NATURAL)69Events, Trends,
- Page 74 and 75:
GYPSUM71Through 2010, more than 3,6
- Page 76 and 77:
HELIUM73Events, Trends, and Issues:
- Page 78 and 79:
INDIUM75China’s 21 indium produce
- Page 80 and 81:
IODINE77Events, Trends, and Issues:
- Page 82 and 83:
IRON AND STEEL79Events, Trends, and
- Page 84 and 85:
IRON AND STEEL SCRAP81Tariff: Item
- Page 86 and 87:
IRON AND STEEL SLAG83Events, Trends
- Page 88 and 89:
IRON ORE85In 2009, China imported a
- Page 90 and 91:
IRON OXIDE PIGMENTS87Events, Trends
- Page 92 and 93:
KYANITE AND RELATED MATERIALS89Even
- Page 94 and 95:
LEAD91caused by underground fires a
- Page 96 and 97:
LIME93The lime industry is facing p
- Page 98 and 99: LITHIUM95market, and a facility at
- Page 100 and 101: MAGNESIUM COMPOUNDS97In Australia,
- Page 102 and 103: MAGNESIUM METAL99U.S. magnesium con
- Page 104 and 105: MANGANESE101Government Stockpile:St
- Page 106 and 107: MERCURY103Events, Trends, and Issue
- Page 108 and 109: MICA (NATURAL)105Depletion Allowanc
- Page 110 and 111: MOLYBDENUM107Events, Trends, and Is
- Page 112 and 113: NICKEL109Nickel prices were adverse
- Page 114 and 115: NIOBIUM (COLUMBIUM)111Events, Trend
- Page 116 and 117: NITROGEN (FIXED)—AMMONIA113Accord
- Page 118 and 119: PEAT115Events, Trends, and Issues:
- Page 120 and 121: PERLITE117Events, Trends, and Issue
- Page 122 and 123: PHOSPHATE ROCK119Events, Trends, an
- Page 124 and 125: PLATINUM-GROUP METALS121Events, Tre
- Page 126 and 127: POTASH123Events, Trends, and Issues
- Page 128 and 129: PUMICE AND PUMICITE125Events, Trend
- Page 130 and 131: QUARTZ CRYSTAL (INDUSTRIAL)127Event
- Page 132 and 133: RARE EARTHS129Events, Trends, and I
- Page 134 and 135: RHENIUM131Events, Trends, and Issue
- Page 136 and 137: RUBIDIUM133Events, Trends, and Issu
- Page 138 and 139: SALT135Many chefs have advocated us
- Page 140 and 141: SAND AND GRAVEL (CONSTRUCTION)137Ev
- Page 142 and 143: SAND AND GRAVEL (INDUSTRIAL)139The
- Page 144 and 145: SCANDIUM141Scandium’s use in meta
- Page 146 and 147: SELENIUM143Events, Trends, and Issu
- Page 150 and 151: SILVER147Silver was used as a repla
- Page 152 and 153: SODA ASH149A Wyoming soda ash produ
- Page 154 and 155: SODIUM SULFATE151Events, Trends, an
- Page 156 and 157: STONE (CRUSHED)153Events, Trends, a
- Page 158 and 159: STONE (DIMENSION)155Events, Trends,
- Page 160 and 161: STRONTIUM157Events, Trends, and Iss
- Page 162 and 163: SULFUR159World sulfur production in
- Page 164 and 165: TALC AND PYROPHYLLITE161Events, Tre
- Page 166 and 167: TANTALUM163Events, Trends, and Issu
- Page 168 and 169: TELLURIUM165Events, Trends, and Iss
- Page 170: THALLIUM167Beginning in 2009, there
- Page 173 and 174: 170TIN(Data in metric tons of tin c
- Page 175 and 176: 172TITANIUM AND TITANIUM DIOXIDE 1(
- Page 177 and 178: 174TITANIUM MINERAL CONCENTRATES 1(
- Page 179 and 180: 176TUNGSTEN(Data in metric tons of
- Page 181 and 182: 178VANADIUM(Data in metric tons of
- Page 183 and 184: 180VERMICULITE(Data in thousand met
- Page 185 and 186: 182WOLLASTONITE(Data in metric tons
- Page 187 and 188: 184YTTRIUM 1(Data in metric tons of
- Page 189 and 190: 186ZEOLITES (NATURAL)(Data in metri
- Page 191 and 192: 188ZINC(Data in thousand metric ton
- Page 193 and 194: 190ZIRCONIUM AND HAFNIUM(Data in me
- Page 195 and 196: 192APPENDIX AAbbreviations and Unit
- Page 197 and 198: 194Demonstrated.—A term for the s
- Page 199 and 200:
196Part B—Sources of Reserves Dat
- Page 201:
198Europe and Central Eurasia—con


