GARNET (INDUSTRIAL)61Events, Trends, <strong>and</strong> Issues: During 2010, domestic U.S. production of crude garnet concentrates increased by 18%compared with the production of 2009. U.S. garnet consumption increased slightly compared with that of 2009. In2010, imports were estimated to have decreased 21% compared with those of 2009, <strong>and</strong> exports were estimated tohave decreased 7% from those of 2009. The 2010 estimated domestic sales of garnet increased by 18% comparedwith sales of 2009. In 2010, the United States remained a net importer. Garnet imports have supplemented U.S.production in the domestic market, with Australia, Canada, China, <strong>and</strong> India being major garnet suppliers.The garnet market is very competitive. To increase profitability <strong>and</strong> remain competitive with foreign imported material,production may be restricted to only high-grade garnet ores or other salable mineral products that occur with garnet,such as kyanite, marble, mica minerals, sillimanite, staurolite, wollastonite, or metallic ores.World Mine Production <strong>and</strong> Reserves:Mine production Reserves 52009 2010 eUnited States 45,600 54,000 5,000,000Australia 160,000 150,000 1,000,000China 450,000 470,000 Moderate to LargeIndia 700,000 700,000 6,500,000Other countries 35,500 36,0006,500,000World total (rounded) 1,390,000 1,410,000 Moderate to LargeWorld Resources: World resources of garnet are large <strong>and</strong> occur in a wide variety of rocks, particularly gneisses <strong>and</strong>schists. Garnet also occurs in contact-metamorphic deposits in crystalline limestones, pegmatites, serpentinites, <strong>and</strong>vein deposits. In addition, alluvial garnet is present in many heavy-mineral s<strong>and</strong> <strong>and</strong> gravel deposits throughout theworld. Large domestic resources of garnet also are concentrated in coarsely crystalline gneiss near North Creek, NY;other significant domestic resources of garnet occur in Idaho, Maine, Montana, New Hampshire, North Carolina, <strong>and</strong>Oregon. In addition to those in the United States, major garnet deposits exist in Australia, Canada, China, <strong>and</strong> India,where they are mined for foreign <strong>and</strong> domestic markets; deposits in Russia <strong>and</strong> Turkey also have been mined inrecent years, primarily for internal markets. Additional garnet resources are in Chile, Czech Republic, Pakistan, SouthAfrica, Spain, Thail<strong>and</strong>, <strong>and</strong> Ukraine; small mining operations have been reported in most of these countries.Substitutes: Other natural <strong>and</strong> manufactured abrasives can substitute to some extent for all major end uses ofgarnet. In many cases, however, the substitutes would entail sacrifices in quality or cost. Fused aluminum oxide <strong>and</strong>staurolite compete with garnet as a s<strong>and</strong>blasting material. Ilmenite, magnetite, <strong>and</strong> plastics compete as filtrationmedia. Diamond, corundum, <strong>and</strong> fused aluminum oxide compete for lens grinding <strong>and</strong> for many lapping operations.Emery is a substitute in nonskid surfaces. Finally, quartz s<strong>and</strong>, silicon carbide, <strong>and</strong> fused aluminum oxide compete forthe finishing of plastics, wood furniture, <strong>and</strong> other products.e Estimated. NA Not available.1 Excludes gem <strong>and</strong> synthetic garnet.2 Defined as crude production – exports + imports.3 Includes both crude <strong>and</strong> refined garnet; most crude concentrate is $50 to $120 per ton, <strong>and</strong> most refined material is $150 to $450 per ton.4 Defined as imports – exports.5 See Appendix C for resource/reserve definitions <strong>and</strong> information concerning data sources.U.S. Geological Survey, <strong>Mineral</strong> <strong>Commodity</strong> <strong>Summaries</strong>, January <strong>2011</strong>
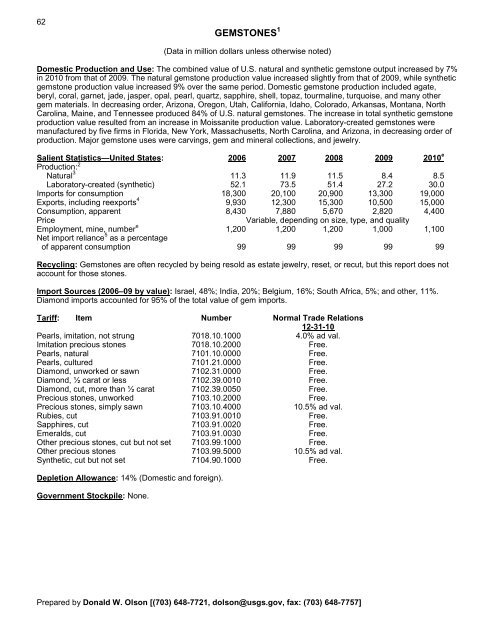
62GEMSTONES 1(Data in million dollars unless otherwise noted)Domestic Production <strong>and</strong> Use: The combined value of U.S. natural <strong>and</strong> synthetic gemstone output increased by 7%in 2010 from that of 2009. The natural gemstone production value increased slightly from that of 2009, while syntheticgemstone production value increased 9% over the same period. Domestic gemstone production included agate,beryl, coral, garnet, jade, jasper, opal, pearl, quartz, sapphire, shell, topaz, tourmaline, turquoise, <strong>and</strong> many othergem materials. In decreasing order, Arizona, Oregon, Utah, California, Idaho, Colorado, Arkansas, Montana, NorthCarolina, Maine, <strong>and</strong> Tennessee produced 84% of U.S. natural gemstones. The increase in total synthetic gemstoneproduction value resulted from an increase in Moissanite production value. Laboratory-created gemstones weremanufactured by five firms in Florida, New York, Massachusetts, North Carolina, <strong>and</strong> Arizona, in decreasing order ofproduction. Major gemstone uses were carvings, gem <strong>and</strong> mineral collections, <strong>and</strong> jewelry.Salient Statistics—United States: 2006 2007 2008 2009 2010 eProduction: 2Natural 3 11.3 11.9 11.5 8.4 8.5Laboratory-created (synthetic) 52.1 73.5 51.4 27.2 30.0Imports for consumption 18,300 20,100 20,900 13,300 19,000Exports, including reexports 4 9,930 12,300 15,300 10,500 15,000Consumption, apparent 8,430 7,880 5,670 2,820 4,400PriceVariable, depending on size, type, <strong>and</strong> qualityEmployment, mine, number e 1,200 1,200 1,200 1,000 1,100Net import reliance 5 as a percentageof apparent consumption 99 99 99 99 99Recycling: Gemstones are often recycled by being resold as estate jewelry, reset, or recut, but this report does notaccount for those stones.Import Sources (2006–09 by value): Israel, 48%; India, 20%; Belgium, 16%; South Africa, 5%; <strong>and</strong> other, 11%.Diamond imports accounted for 95% of the total value of gem imports.Tariff: Item Number Normal Trade Relations12-31-10Pearls, imitation, not strung 7018.10.1000 4.0% ad val.Imitation precious stones 7018.10.2000 Free.Pearls, natural 7101.10.0000 Free.Pearls, cultured 7101.21.0000 Free.Diamond, unworked or sawn 7102.31.0000 Free.Diamond, ½ carat or less 7102.39.0010 Free.Diamond, cut, more than ½ carat 7102.39.0050 Free.Precious stones, unworked 7103.10.2000 Free.Precious stones, simply sawn 7103.10.4000 10.5% ad val.Rubies, cut 7103.91.0010 Free.Sapphires, cut 7103.91.0020 Free.Emeralds, cut 7103.91.0030 Free.Other precious stones, cut but not set 7103.99.1000 Free.Other precious stones 7103.99.5000 10.5% ad val.Synthetic, cut but not set 7104.90.1000 Free.Depletion Allowance: 14% (Domestic <strong>and</strong> foreign).Government Stockpile: None.Prepared by Donald W. Olson [(703) 648-7721, dolson@usgs.gov, fax: (703) 648-7757]
- Page 3:
U.S. Department of the InteriorKEN
- Page 6 and 7:
INTRODUCTION3Each chapter of the 20
- Page 8 and 9:
5NET EXPORTS OF MINERALRAW MATERIAL
- Page 10 and 11:
SIGNIFICANT EVENTS, TRENDS, AND ISS
- Page 12 and 13:
mineral materials valued at $1.30 b
- Page 14 and 15: 11MAJOR METAL-PRODUCING AREASAuB2P1
- Page 16 and 17: 13MAJOR INDUSTRIAL MINERAL-PRODUCIN
- Page 18 and 19: ABRASIVES (MANUFACTURED)15Events, T
- Page 20 and 21: ALUMINUM17The United States continu
- Page 22 and 23: ANTIMONY19Events, Trends, and Issue
- Page 24 and 25: ARSENIC21According to university me
- Page 26 and 27: ASBESTOS23Events, Trends, and Issue
- Page 28 and 29: BARITE25Nationally, the rig count o
- Page 30 and 31: BAUXITE AND ALUMINA27Events, Trends
- Page 32 and 33: BERYLLIUM29Events, Trends, and Issu
- Page 34 and 35: BISMUTH31Events, Trends, and Issues
- Page 36 and 37: BORON33Events, Trends, and Issues:
- Page 38 and 39: BROMINE35Events, Trends, and Issues
- Page 40 and 41: CADMIUM37NiCd battery use in consum
- Page 42 and 43: CEMENT39The manufacture of clinker
- Page 44 and 45: CESIUM41Events, Trends, and Issues:
- Page 46 and 47: CHROMIUM43Stockpile Status—9-30-1
- Page 48 and 49: CLAYS45Tariff: Item Number Normal T
- Page 50 and 51: COBALT47Events, Trends, and Issues:
- Page 52 and 53: COPPER49Events, Trends, and Issues:
- Page 54 and 55: DIAMOND (INDUSTRIAL)51Events, Trend
- Page 56 and 57: DIATOMITE53Events, Trends, and Issu
- Page 58 and 59: FELDSPAR55Feldspar use in tile and
- Page 60 and 61: FLUORSPAR57with planned output of 1
- Page 62 and 63: GALLIUM59In response to the unprece
- Page 66 and 67: GEMSTONES63Events, Trends, and Issu
- Page 68 and 69: GERMANIUM65Events, Trends, and Issu
- Page 70 and 71: GOLD67With the increase in price of
- Page 72 and 73: GRAPHITE (NATURAL)69Events, Trends,
- Page 74 and 75: GYPSUM71Through 2010, more than 3,6
- Page 76 and 77: HELIUM73Events, Trends, and Issues:
- Page 78 and 79: INDIUM75China’s 21 indium produce
- Page 80 and 81: IODINE77Events, Trends, and Issues:
- Page 82 and 83: IRON AND STEEL79Events, Trends, and
- Page 84 and 85: IRON AND STEEL SCRAP81Tariff: Item
- Page 86 and 87: IRON AND STEEL SLAG83Events, Trends
- Page 88 and 89: IRON ORE85In 2009, China imported a
- Page 90 and 91: IRON OXIDE PIGMENTS87Events, Trends
- Page 92 and 93: KYANITE AND RELATED MATERIALS89Even
- Page 94 and 95: LEAD91caused by underground fires a
- Page 96 and 97: LIME93The lime industry is facing p
- Page 98 and 99: LITHIUM95market, and a facility at
- Page 100 and 101: MAGNESIUM COMPOUNDS97In Australia,
- Page 102 and 103: MAGNESIUM METAL99U.S. magnesium con
- Page 104 and 105: MANGANESE101Government Stockpile:St
- Page 106 and 107: MERCURY103Events, Trends, and Issue
- Page 108 and 109: MICA (NATURAL)105Depletion Allowanc
- Page 110 and 111: MOLYBDENUM107Events, Trends, and Is
- Page 112 and 113: NICKEL109Nickel prices were adverse
- Page 114 and 115:
NIOBIUM (COLUMBIUM)111Events, Trend
- Page 116 and 117:
NITROGEN (FIXED)—AMMONIA113Accord
- Page 118 and 119:
PEAT115Events, Trends, and Issues:
- Page 120 and 121:
PERLITE117Events, Trends, and Issue
- Page 122 and 123:
PHOSPHATE ROCK119Events, Trends, an
- Page 124 and 125:
PLATINUM-GROUP METALS121Events, Tre
- Page 126 and 127:
POTASH123Events, Trends, and Issues
- Page 128 and 129:
PUMICE AND PUMICITE125Events, Trend
- Page 130 and 131:
QUARTZ CRYSTAL (INDUSTRIAL)127Event
- Page 132 and 133:
RARE EARTHS129Events, Trends, and I
- Page 134 and 135:
RHENIUM131Events, Trends, and Issue
- Page 136 and 137:
RUBIDIUM133Events, Trends, and Issu
- Page 138 and 139:
SALT135Many chefs have advocated us
- Page 140 and 141:
SAND AND GRAVEL (CONSTRUCTION)137Ev
- Page 142 and 143:
SAND AND GRAVEL (INDUSTRIAL)139The
- Page 144 and 145:
SCANDIUM141Scandium’s use in meta
- Page 146 and 147:
SELENIUM143Events, Trends, and Issu
- Page 148 and 149:
SILICON145Events, Trends, and Issue
- Page 150 and 151:
SILVER147Silver was used as a repla
- Page 152 and 153:
SODA ASH149A Wyoming soda ash produ
- Page 154 and 155:
SODIUM SULFATE151Events, Trends, an
- Page 156 and 157:
STONE (CRUSHED)153Events, Trends, a
- Page 158 and 159:
STONE (DIMENSION)155Events, Trends,
- Page 160 and 161:
STRONTIUM157Events, Trends, and Iss
- Page 162 and 163:
SULFUR159World sulfur production in
- Page 164 and 165:
TALC AND PYROPHYLLITE161Events, Tre
- Page 166 and 167:
TANTALUM163Events, Trends, and Issu
- Page 168 and 169:
TELLURIUM165Events, Trends, and Iss
- Page 170:
THALLIUM167Beginning in 2009, there
- Page 173 and 174:
170TIN(Data in metric tons of tin c
- Page 175 and 176:
172TITANIUM AND TITANIUM DIOXIDE 1(
- Page 177 and 178:
174TITANIUM MINERAL CONCENTRATES 1(
- Page 179 and 180:
176TUNGSTEN(Data in metric tons of
- Page 181 and 182:
178VANADIUM(Data in metric tons of
- Page 183 and 184:
180VERMICULITE(Data in thousand met
- Page 185 and 186:
182WOLLASTONITE(Data in metric tons
- Page 187 and 188:
184YTTRIUM 1(Data in metric tons of
- Page 189 and 190:
186ZEOLITES (NATURAL)(Data in metri
- Page 191 and 192:
188ZINC(Data in thousand metric ton
- Page 193 and 194:
190ZIRCONIUM AND HAFNIUM(Data in me
- Page 195 and 196:
192APPENDIX AAbbreviations and Unit
- Page 197 and 198:
194Demonstrated.—A term for the s
- Page 199 and 200:
196Part B—Sources of Reserves Dat
- Page 201:
198Europe and Central Eurasia—con