SILVER147Silver was used as a replacement metal for platinum in catalytic converters in automobiles. Silver also was used inclothing to help regulate body heat <strong>and</strong> to control odor in shoes <strong>and</strong> in sports <strong>and</strong> everyday clothing. The use of traceamounts of silver in b<strong>and</strong>ages for wound care <strong>and</strong> minor skin infections is also increasing.World silver mine production increased to 22,200 tons as a result of increased production at new <strong>and</strong> existingpolymetallic mines. Global silver output increased owing to a full year’s production from the San Cristobal Mine inBolivia, the Dolores <strong>and</strong> Parmarejo Mines in Mexico, <strong>and</strong> the Kupol property in Russia. Production from several minesin Argentina also increased. Silver production increased at lead-zinc mines, such as the Lucky Friday Mine in Idaho,where production was at its highest level in 10 years. Production at the Greens Creek Mine in Alaska also increasedowing to improved mining techniques, <strong>and</strong> production from the Bingham Canyon Mine in Utah increased because ofincreased mill throughput. In July, the Rochester Mine in Nevada was preparing to mine new ore zones that wouldextend mine life by several years.World Mine Production <strong>and</strong> Reserves: Reserves information for Peru <strong>and</strong> Pol<strong>and</strong> was revised based on newinformation from Government <strong>and</strong> industry sources.Mine production Reserves 92009 2010 eUnited States 1,250 1,280 25,000Australia 1,630 1,700 69,000Bolivia 1,300 1,360 22,000Canada 600 700 7,000Chile 1,300 1,500 70,000China 2,900 3,000 43,000Mexico 3,550 3,500 37,000Peru 3,850 4,000 120,000Pol<strong>and</strong> 1,200 1,200 69,000Russia 1,400 1,400 NAOther countries 2,820 2,60050,000World total (rounded) 21,800 22,200 510,000World Resources: Silver was obtained as a primary product from mines in Mexico, Peru, <strong>and</strong> Australia, indescending order of production. Silver was also obtained as a byproduct from lead-zinc mines, copper mines, <strong>and</strong>gold mines, in descending order of production. The polymetallic ore deposits from which silver is recovered accountfor more than two-thirds of U.S. <strong>and</strong> world resources of silver. Most recent silver discoveries have been associatedwith gold occurrences; however, copper <strong>and</strong> lead-zinc occurrences that contain byproduct silver will continue toaccount for a significant share of future reserves <strong>and</strong> resources.Substitutes: Digital imaging, film with reduced silver content, silverless black-<strong>and</strong>-white film, <strong>and</strong> xerographysubstitute for silver that has traditionally been used in black-<strong>and</strong>-white as well as color printing applications. Surgicalpins <strong>and</strong> plates may be made with tantalum <strong>and</strong> titanium in place of silver. Stainless steel may be substituted forsilver flatware, <strong>and</strong> germanium added to silver flatware will make it tarnish resistant. Nonsilver batteries may replacesilver batteries in some applications. Aluminum <strong>and</strong> rhodium may be used to replace silver that was traditionally usedin mirrors <strong>and</strong> other reflecting surfaces. Silver may be used to replace more costly metals in catalytic converters foroff-road vehicles.e Estimated. NA Not available.1 One metric ton (1,000 kilograms) = 32,150.7 troy ounces.2 Ores <strong>and</strong> concentrates, refined bullion, doré, <strong>and</strong> other unwrought silver; excludes coinage, <strong>and</strong> waste <strong>and</strong> scrap material.3 H<strong>and</strong>y & Harman quotations.4 Balance in U.S. Mint only.5 NYSE Liffe: formerly Chicago Board of Trade.6 Held in the United Kingdom by ETF Securities <strong>and</strong> iShares Silver Trust <strong>and</strong> in Switzerl<strong>and</strong> by Zürcher Kantonalbank.7 Source: U.S. Department of Labor, Mine Safety <strong>and</strong> Health Administration.8 Defined as imports – exports + adjustments for Government <strong>and</strong> industry stock changes.9 See Appendix C for resource/reserve definitions <strong>and</strong> information concerning data sources.U.S. Geological Survey, <strong>Mineral</strong> <strong>Commodity</strong> <strong>Summaries</strong>, January <strong>2011</strong>
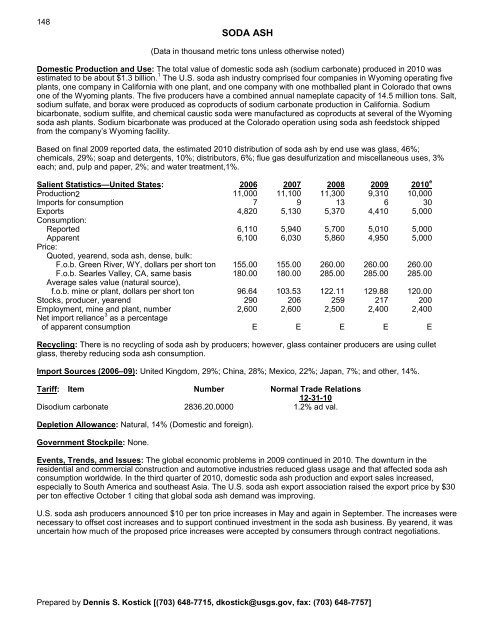
148SODA ASH(Data in thous<strong>and</strong> metric tons unless otherwise noted)Domestic Production <strong>and</strong> Use: The total value of domestic soda ash (sodium carbonate) produced in 2010 wasestimated to be about $1.3 billion. 1 The U.S. soda ash industry comprised four companies in Wyoming operating fiveplants, one company in California with one plant, <strong>and</strong> one company with one mothballed plant in Colorado that ownsone of the Wyoming plants. The five producers have a combined annual nameplate capacity of 14.5 million tons. Salt,sodium sulfate, <strong>and</strong> borax were produced as coproducts of sodium carbonate production in California. Sodiumbicarbonate, sodium sulfite, <strong>and</strong> chemical caustic soda were manufactured as coproducts at several of the Wyomingsoda ash plants. Sodium bicarbonate was produced at the Colorado operation using soda ash feedstock shippedfrom the company’s Wyoming facility.Based on final 2009 reported data, the estimated 2010 distribution of soda ash by end use was glass, 46%;chemicals, 29%; soap <strong>and</strong> detergents, 10%; distributors, 6%; flue gas desulfurization <strong>and</strong> miscellaneous uses, 3%each; <strong>and</strong>, pulp <strong>and</strong> paper, 2%; <strong>and</strong> water treatment,1%.Salient Statistics—United States: 2006 2007 2008 2009 2010 eProduction2 11,000 11,100 11,300 9,310 10,000Imports for consumption 7 9 13 6 30Exports 4,820 5,130 5,370 4,410 5,000Consumption:Reported 6,110 5,940 5,700 5,010 5,000Apparent 6,100 6,030 5,860 4,950 5,000Price:Quoted, yearend, soda ash, dense, bulk:F.o.b. Green River, WY, dollars per short ton 155.00 155.00 260.00 260.00 260.00F.o.b. Searles Valley, CA, same basis 180.00 180.00 285.00 285.00 285.00Average sales value (natural source),f.o.b. mine or plant, dollars per short ton 96.64 103.53 122.11 129.88 120.00Stocks, producer, yearend 290 206 259 217 200Employment, mine <strong>and</strong> plant, number 2,600 2,600 2,500 2,400 2,400Net import reliance 3 as a percentageof apparent consumption E E E E ERecycling: There is no recycling of soda ash by producers; however, glass container producers are using culletglass, thereby reducing soda ash consumption.Import Sources (2006–09): United Kingdom, 29%; China, 28%; Mexico, 22%; Japan, 7%; <strong>and</strong> other, 14%.Tariff: Item Number Normal Trade Relations12-31-10Disodium carbonate 2836.20.0000 1.2% ad val.Depletion Allowance: Natural, 14% (Domestic <strong>and</strong> foreign).Government Stockpile: None.Events, Trends, <strong>and</strong> Issues: The global economic problems in 2009 continued in 2010. The downturn in theresidential <strong>and</strong> commercial construction <strong>and</strong> automotive industries reduced glass usage <strong>and</strong> that affected soda ashconsumption worldwide. In the third quarter of 2010, domestic soda ash production <strong>and</strong> export sales increased,especially to South America <strong>and</strong> southeast Asia. The U.S. soda ash export association raised the export price by $30per ton effective October 1 citing that global soda ash dem<strong>and</strong> was improving.U.S. soda ash producers announced $10 per ton price increases in May <strong>and</strong> again in September. The increases werenecessary to offset cost increases <strong>and</strong> to support continued investment in the soda ash business. By yearend, it wasuncertain how much of the proposed price increases were accepted by consumers through contract negotiations.Prepared by Dennis S. Kostick [(703) 648-7715, dkostick@usgs.gov, fax: (703) 648-7757]
- Page 3:
U.S. Department of the InteriorKEN
- Page 6 and 7:
INTRODUCTION3Each chapter of the 20
- Page 8 and 9:
5NET EXPORTS OF MINERALRAW MATERIAL
- Page 10 and 11:
SIGNIFICANT EVENTS, TRENDS, AND ISS
- Page 12 and 13:
mineral materials valued at $1.30 b
- Page 14 and 15:
11MAJOR METAL-PRODUCING AREASAuB2P1
- Page 16 and 17:
13MAJOR INDUSTRIAL MINERAL-PRODUCIN
- Page 18 and 19:
ABRASIVES (MANUFACTURED)15Events, T
- Page 20 and 21:
ALUMINUM17The United States continu
- Page 22 and 23:
ANTIMONY19Events, Trends, and Issue
- Page 24 and 25:
ARSENIC21According to university me
- Page 26 and 27:
ASBESTOS23Events, Trends, and Issue
- Page 28 and 29:
BARITE25Nationally, the rig count o
- Page 30 and 31:
BAUXITE AND ALUMINA27Events, Trends
- Page 32 and 33:
BERYLLIUM29Events, Trends, and Issu
- Page 34 and 35:
BISMUTH31Events, Trends, and Issues
- Page 36 and 37:
BORON33Events, Trends, and Issues:
- Page 38 and 39:
BROMINE35Events, Trends, and Issues
- Page 40 and 41:
CADMIUM37NiCd battery use in consum
- Page 42 and 43:
CEMENT39The manufacture of clinker
- Page 44 and 45:
CESIUM41Events, Trends, and Issues:
- Page 46 and 47:
CHROMIUM43Stockpile Status—9-30-1
- Page 48 and 49:
CLAYS45Tariff: Item Number Normal T
- Page 50 and 51:
COBALT47Events, Trends, and Issues:
- Page 52 and 53:
COPPER49Events, Trends, and Issues:
- Page 54 and 55:
DIAMOND (INDUSTRIAL)51Events, Trend
- Page 56 and 57:
DIATOMITE53Events, Trends, and Issu
- Page 58 and 59:
FELDSPAR55Feldspar use in tile and
- Page 60 and 61:
FLUORSPAR57with planned output of 1
- Page 62 and 63:
GALLIUM59In response to the unprece
- Page 64 and 65:
GARNET (INDUSTRIAL)61Events, Trends
- Page 66 and 67:
GEMSTONES63Events, Trends, and Issu
- Page 68 and 69:
GERMANIUM65Events, Trends, and Issu
- Page 70 and 71:
GOLD67With the increase in price of
- Page 72 and 73:
GRAPHITE (NATURAL)69Events, Trends,
- Page 74 and 75:
GYPSUM71Through 2010, more than 3,6
- Page 76 and 77:
HELIUM73Events, Trends, and Issues:
- Page 78 and 79:
INDIUM75China’s 21 indium produce
- Page 80 and 81:
IODINE77Events, Trends, and Issues:
- Page 82 and 83:
IRON AND STEEL79Events, Trends, and
- Page 84 and 85:
IRON AND STEEL SCRAP81Tariff: Item
- Page 86 and 87:
IRON AND STEEL SLAG83Events, Trends
- Page 88 and 89:
IRON ORE85In 2009, China imported a
- Page 90 and 91:
IRON OXIDE PIGMENTS87Events, Trends
- Page 92 and 93:
KYANITE AND RELATED MATERIALS89Even
- Page 94 and 95:
LEAD91caused by underground fires a
- Page 96 and 97:
LIME93The lime industry is facing p
- Page 98 and 99:
LITHIUM95market, and a facility at
- Page 100 and 101: MAGNESIUM COMPOUNDS97In Australia,
- Page 102 and 103: MAGNESIUM METAL99U.S. magnesium con
- Page 104 and 105: MANGANESE101Government Stockpile:St
- Page 106 and 107: MERCURY103Events, Trends, and Issue
- Page 108 and 109: MICA (NATURAL)105Depletion Allowanc
- Page 110 and 111: MOLYBDENUM107Events, Trends, and Is
- Page 112 and 113: NICKEL109Nickel prices were adverse
- Page 114 and 115: NIOBIUM (COLUMBIUM)111Events, Trend
- Page 116 and 117: NITROGEN (FIXED)—AMMONIA113Accord
- Page 118 and 119: PEAT115Events, Trends, and Issues:
- Page 120 and 121: PERLITE117Events, Trends, and Issue
- Page 122 and 123: PHOSPHATE ROCK119Events, Trends, an
- Page 124 and 125: PLATINUM-GROUP METALS121Events, Tre
- Page 126 and 127: POTASH123Events, Trends, and Issues
- Page 128 and 129: PUMICE AND PUMICITE125Events, Trend
- Page 130 and 131: QUARTZ CRYSTAL (INDUSTRIAL)127Event
- Page 132 and 133: RARE EARTHS129Events, Trends, and I
- Page 134 and 135: RHENIUM131Events, Trends, and Issue
- Page 136 and 137: RUBIDIUM133Events, Trends, and Issu
- Page 138 and 139: SALT135Many chefs have advocated us
- Page 140 and 141: SAND AND GRAVEL (CONSTRUCTION)137Ev
- Page 142 and 143: SAND AND GRAVEL (INDUSTRIAL)139The
- Page 144 and 145: SCANDIUM141Scandium’s use in meta
- Page 146 and 147: SELENIUM143Events, Trends, and Issu
- Page 148 and 149: SILICON145Events, Trends, and Issue
- Page 152 and 153: SODA ASH149A Wyoming soda ash produ
- Page 154 and 155: SODIUM SULFATE151Events, Trends, an
- Page 156 and 157: STONE (CRUSHED)153Events, Trends, a
- Page 158 and 159: STONE (DIMENSION)155Events, Trends,
- Page 160 and 161: STRONTIUM157Events, Trends, and Iss
- Page 162 and 163: SULFUR159World sulfur production in
- Page 164 and 165: TALC AND PYROPHYLLITE161Events, Tre
- Page 166 and 167: TANTALUM163Events, Trends, and Issu
- Page 168 and 169: TELLURIUM165Events, Trends, and Iss
- Page 170: THALLIUM167Beginning in 2009, there
- Page 173 and 174: 170TIN(Data in metric tons of tin c
- Page 175 and 176: 172TITANIUM AND TITANIUM DIOXIDE 1(
- Page 177 and 178: 174TITANIUM MINERAL CONCENTRATES 1(
- Page 179 and 180: 176TUNGSTEN(Data in metric tons of
- Page 181 and 182: 178VANADIUM(Data in metric tons of
- Page 183 and 184: 180VERMICULITE(Data in thousand met
- Page 185 and 186: 182WOLLASTONITE(Data in metric tons
- Page 187 and 188: 184YTTRIUM 1(Data in metric tons of
- Page 189 and 190: 186ZEOLITES (NATURAL)(Data in metri
- Page 191 and 192: 188ZINC(Data in thousand metric ton
- Page 193 and 194: 190ZIRCONIUM AND HAFNIUM(Data in me
- Page 195 and 196: 192APPENDIX AAbbreviations and Unit
- Page 197 and 198: 194Demonstrated.—A term for the s
- Page 199 and 200: 196Part B—Sources of Reserves Dat
- Page 201:
198Europe and Central Eurasia—con