IODINE77Events, Trends, <strong>and</strong> Issues: Dem<strong>and</strong> for iodine has been driven in recent years by consumption for liquid crystaldisplays (LCD) <strong>and</strong> x-ray contrast media. With increased dem<strong>and</strong> in these two sectors <strong>and</strong> global iodine productionremaining constant, an imbalance between supply <strong>and</strong> dem<strong>and</strong> was created <strong>and</strong> resulted in iodine prices increasingby 19% from 2008 to 2009. As consumption of iodine in biocides, LCDs, <strong>and</strong> nylon declined owing to the globaleconomic downturn, prices remained relatively firm. The prices in 2010 were estimated to decrease slightly fromthose of 2009, but were projected to be more than 10% greater than those of 2008. With an economic recoveryexpected, dem<strong>and</strong> for iodine used in biocides, iodine salts, LCDs, synthetic fabric treatments, <strong>and</strong> x-ray contrastmedia was expected to increase at a rate of between 3.5% <strong>and</strong> 4% per year during the next decade.As in previous years, Chile was the world’s leading producer of iodine, followed by Japan <strong>and</strong> the United States. Chileaccounted for more than 50% of world production, having two of the leading iodine producers in the world. The largestChilean producer reported a 20% decrease in sales from 2008 to 2009, which was attributed to the global economicdownturn. In response to the downturn, the company announced the suspension of operations at one of its miningfacilities. The third largest Chilean producer initiated a new project at Algorta, Chile, which was expected to replace itscurrent operation at Lagunas, Chile.Several governmental programs were expected to affect future iodine dem<strong>and</strong>. The European Union prohibited its 27member countries from using or selling iodine for the purpose of disinfecting drinking water. China’s Ministry of Healthannounced the reduction of iodine content in salt owing to fears that iodized salt is causing a rise in thyroid disease.The U.S. <strong>Environmental</strong> Protection Agency approved the restricted use of the soil fumigant iodomethane (methyliodide) as an alternative to ozone-depleting methyl bromide. Australia <strong>and</strong> Belgium required bread manufacturers touse iodized salt with the intent of limiting iodine deficiency in their populations.World Mine Production <strong>and</strong> Reserves: The iodine reserves for Japan have been revised based on new informationfrom the country.Mine production Reserves 22009 2010 eUnited States W W 250,000Azerbaijan 300 300 170,000Chile 17,400 18,000 9,000,000China 580 590 4,000Indonesia 75 75 100,000Japan 9,600 9,800 5,000,000Russia 300 300 120,000Turkmenistan 270 270 170,000Uzbekistan 2 2NAWorld total (rounded)28,50029,000 15,000,000World Resources: In addition to the reserves shown above, seawater contains 0.05 parts per million iodine, orapproximately 34 million tons. Seaweeds of the Laminaria family are able to extract <strong>and</strong> accumulate up to 0.45%iodine on a dry basis. Although not as economical as the production of iodine as a byproduct of gas, nitrate, <strong>and</strong> oil,the seaweed industry represented a major source of iodine prior to 1959 <strong>and</strong> remains a large resource.Substitutes: There are no comparable substitutes for iodine in many of its principal applications, such as in animalfeed, catalytic, nutritional, pharmaceutical, <strong>and</strong> photographic uses. Bromine <strong>and</strong> chlorine could be substituted foriodine in biocide, colorant, <strong>and</strong> ink, although they are usually considered less desirable than iodine. Antibiotics can beused as a substitute for iodine biocides.e Estimated. NA Not available. W Withheld to avoid disclosing company proprietary data. — Zero.1 Defined as imports – exports + adjustments for Government <strong>and</strong> industry stock changes.2 See Appendix C for resource/reserve definitions <strong>and</strong> information concerning data sources.3 Excludes U.S. production.U.S. Geological Survey, <strong>Mineral</strong> <strong>Commodity</strong> <strong>Summaries</strong>, January <strong>2011</strong>
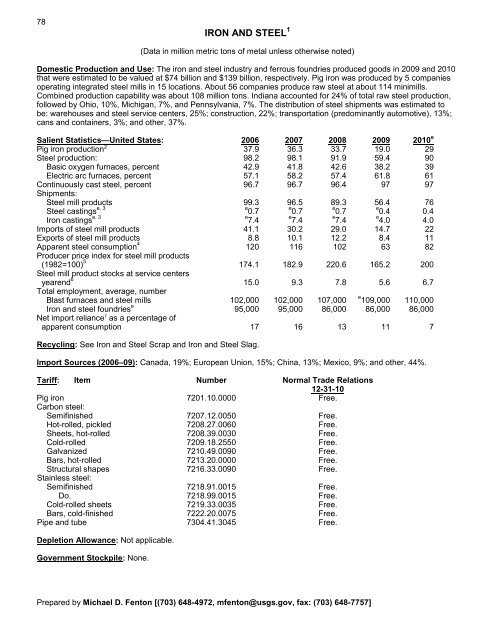
78IRON AND STEEL 1(Data in million metric tons of metal unless otherwise noted)Domestic Production <strong>and</strong> Use: The iron <strong>and</strong> steel industry <strong>and</strong> ferrous foundries produced goods in 2009 <strong>and</strong> 2010that were estimated to be valued at $74 billion <strong>and</strong> $139 billion, respectively. Pig iron was produced by 5 companiesoperating integrated steel mills in 15 locations. About 56 companies produce raw steel at about 114 minimills.Combined production capability was about 108 million tons. Indiana accounted for 24% of total raw steel production,followed by Ohio, 10%, Michigan, 7%, <strong>and</strong> Pennsylvania, 7%. The distribution of steel shipments was estimated tobe: warehouses <strong>and</strong> steel service centers, 25%; construction, 22%; transportation (predominantly automotive), 13%;cans <strong>and</strong> containers, 3%; <strong>and</strong> other, 37%.Salient Statistics—United States: 2006 2007 2008 2009 2010 ePig iron production 2 37.9 36.3 33.7 19.0 29Steel production: 98.2 98.1 91.9 59.4 90Basic oxygen furnaces, percent 42.9 41.8 42.6 38.2 39Electric arc furnaces, percent 57.1 58.2 57.4 61.8 61Continuously cast steel, percent 96.7 96.7 96.4 97 97Shipments:Steel mill products 99.3 96.5 89.3 56.4 76Steel castings e, 3 e 0.70.70.70.4 0.4Iron castings e, 3 e 7.47.47.44.0 4.0Imports of steel mill products 41.1 30.2 29.0 14.7 22Exports of steel mill products 8.8 10.1 12.2 8.4 11Apparent steel consumption 4 120 116 102 63 82Producer price index for steel mill products(1982=100) 5 174.1 182.9 220.6 165.2 200Steel mill product stocks at service centersyearend 6 15.0 9.3 7.8 5.6 6.7Total employment, average, numberBlast furnaces <strong>and</strong> steel mills 102,000 102,000 107,000e 109,000 110,000Iron <strong>and</strong> steel foundries e 95,000 95,000 86,000 86,000 86,000Net import reliance 7 as a percentage ofapparent consumption 17 16 13 11 7Recycling: See Iron <strong>and</strong> Steel Scrap <strong>and</strong> Iron <strong>and</strong> Steel Slag.Import Sources (2006–09): Canada, 19%; European Union, 15%; China, 13%; Mexico, 9%; <strong>and</strong> other, 44%.Tariff: Item Number Normal Trade Relations12-31-10Pig iron 7201.10.0000 Free.Carbon steel:Semifinished 7207.12.0050 Free.Hot-rolled, pickled 7208.27.0060 Free.Sheets, hot-rolled 7208.39.0030 Free.Cold-rolled 7209.18.2550 Free.Galvanized 7210.49.0090 Free.Bars, hot-rolled 7213.20.0000 Free.Structural shapes 7216.33.0090 Free.Stainless steel:Semifinished 7218.91.0015 Free.Do. 7218.99.0015 Free.Cold-rolled sheets 7219.33.0035 Free.Bars, cold-finished 7222.20.0075 Free.Pipe <strong>and</strong> tube 7304.41.3045 Free.Depletion Allowance: Not applicable.Government Stockpile: None.Prepared by Michael D. Fenton [(703) 648-4972, mfenton@usgs.gov, fax: (703) 648-7757]
- Page 3:
U.S. Department of the InteriorKEN
- Page 6 and 7:
INTRODUCTION3Each chapter of the 20
- Page 8 and 9:
5NET EXPORTS OF MINERALRAW MATERIAL
- Page 10 and 11:
SIGNIFICANT EVENTS, TRENDS, AND ISS
- Page 12 and 13:
mineral materials valued at $1.30 b
- Page 14 and 15:
11MAJOR METAL-PRODUCING AREASAuB2P1
- Page 16 and 17:
13MAJOR INDUSTRIAL MINERAL-PRODUCIN
- Page 18 and 19:
ABRASIVES (MANUFACTURED)15Events, T
- Page 20 and 21:
ALUMINUM17The United States continu
- Page 22 and 23:
ANTIMONY19Events, Trends, and Issue
- Page 24 and 25:
ARSENIC21According to university me
- Page 26 and 27:
ASBESTOS23Events, Trends, and Issue
- Page 28 and 29:
BARITE25Nationally, the rig count o
- Page 30 and 31: BAUXITE AND ALUMINA27Events, Trends
- Page 32 and 33: BERYLLIUM29Events, Trends, and Issu
- Page 34 and 35: BISMUTH31Events, Trends, and Issues
- Page 36 and 37: BORON33Events, Trends, and Issues:
- Page 38 and 39: BROMINE35Events, Trends, and Issues
- Page 40 and 41: CADMIUM37NiCd battery use in consum
- Page 42 and 43: CEMENT39The manufacture of clinker
- Page 44 and 45: CESIUM41Events, Trends, and Issues:
- Page 46 and 47: CHROMIUM43Stockpile Status—9-30-1
- Page 48 and 49: CLAYS45Tariff: Item Number Normal T
- Page 50 and 51: COBALT47Events, Trends, and Issues:
- Page 52 and 53: COPPER49Events, Trends, and Issues:
- Page 54 and 55: DIAMOND (INDUSTRIAL)51Events, Trend
- Page 56 and 57: DIATOMITE53Events, Trends, and Issu
- Page 58 and 59: FELDSPAR55Feldspar use in tile and
- Page 60 and 61: FLUORSPAR57with planned output of 1
- Page 62 and 63: GALLIUM59In response to the unprece
- Page 64 and 65: GARNET (INDUSTRIAL)61Events, Trends
- Page 66 and 67: GEMSTONES63Events, Trends, and Issu
- Page 68 and 69: GERMANIUM65Events, Trends, and Issu
- Page 70 and 71: GOLD67With the increase in price of
- Page 72 and 73: GRAPHITE (NATURAL)69Events, Trends,
- Page 74 and 75: GYPSUM71Through 2010, more than 3,6
- Page 76 and 77: HELIUM73Events, Trends, and Issues:
- Page 78 and 79: INDIUM75China’s 21 indium produce
- Page 82 and 83: IRON AND STEEL79Events, Trends, and
- Page 84 and 85: IRON AND STEEL SCRAP81Tariff: Item
- Page 86 and 87: IRON AND STEEL SLAG83Events, Trends
- Page 88 and 89: IRON ORE85In 2009, China imported a
- Page 90 and 91: IRON OXIDE PIGMENTS87Events, Trends
- Page 92 and 93: KYANITE AND RELATED MATERIALS89Even
- Page 94 and 95: LEAD91caused by underground fires a
- Page 96 and 97: LIME93The lime industry is facing p
- Page 98 and 99: LITHIUM95market, and a facility at
- Page 100 and 101: MAGNESIUM COMPOUNDS97In Australia,
- Page 102 and 103: MAGNESIUM METAL99U.S. magnesium con
- Page 104 and 105: MANGANESE101Government Stockpile:St
- Page 106 and 107: MERCURY103Events, Trends, and Issue
- Page 108 and 109: MICA (NATURAL)105Depletion Allowanc
- Page 110 and 111: MOLYBDENUM107Events, Trends, and Is
- Page 112 and 113: NICKEL109Nickel prices were adverse
- Page 114 and 115: NIOBIUM (COLUMBIUM)111Events, Trend
- Page 116 and 117: NITROGEN (FIXED)—AMMONIA113Accord
- Page 118 and 119: PEAT115Events, Trends, and Issues:
- Page 120 and 121: PERLITE117Events, Trends, and Issue
- Page 122 and 123: PHOSPHATE ROCK119Events, Trends, an
- Page 124 and 125: PLATINUM-GROUP METALS121Events, Tre
- Page 126 and 127: POTASH123Events, Trends, and Issues
- Page 128 and 129: PUMICE AND PUMICITE125Events, Trend
- Page 130 and 131:
QUARTZ CRYSTAL (INDUSTRIAL)127Event
- Page 132 and 133:
RARE EARTHS129Events, Trends, and I
- Page 134 and 135:
RHENIUM131Events, Trends, and Issue
- Page 136 and 137:
RUBIDIUM133Events, Trends, and Issu
- Page 138 and 139:
SALT135Many chefs have advocated us
- Page 140 and 141:
SAND AND GRAVEL (CONSTRUCTION)137Ev
- Page 142 and 143:
SAND AND GRAVEL (INDUSTRIAL)139The
- Page 144 and 145:
SCANDIUM141Scandium’s use in meta
- Page 146 and 147:
SELENIUM143Events, Trends, and Issu
- Page 148 and 149:
SILICON145Events, Trends, and Issue
- Page 150 and 151:
SILVER147Silver was used as a repla
- Page 152 and 153:
SODA ASH149A Wyoming soda ash produ
- Page 154 and 155:
SODIUM SULFATE151Events, Trends, an
- Page 156 and 157:
STONE (CRUSHED)153Events, Trends, a
- Page 158 and 159:
STONE (DIMENSION)155Events, Trends,
- Page 160 and 161:
STRONTIUM157Events, Trends, and Iss
- Page 162 and 163:
SULFUR159World sulfur production in
- Page 164 and 165:
TALC AND PYROPHYLLITE161Events, Tre
- Page 166 and 167:
TANTALUM163Events, Trends, and Issu
- Page 168 and 169:
TELLURIUM165Events, Trends, and Iss
- Page 170:
THALLIUM167Beginning in 2009, there
- Page 173 and 174:
170TIN(Data in metric tons of tin c
- Page 175 and 176:
172TITANIUM AND TITANIUM DIOXIDE 1(
- Page 177 and 178:
174TITANIUM MINERAL CONCENTRATES 1(
- Page 179 and 180:
176TUNGSTEN(Data in metric tons of
- Page 181 and 182:
178VANADIUM(Data in metric tons of
- Page 183 and 184:
180VERMICULITE(Data in thousand met
- Page 185 and 186:
182WOLLASTONITE(Data in metric tons
- Page 187 and 188:
184YTTRIUM 1(Data in metric tons of
- Page 189 and 190:
186ZEOLITES (NATURAL)(Data in metri
- Page 191 and 192:
188ZINC(Data in thousand metric ton
- Page 193 and 194:
190ZIRCONIUM AND HAFNIUM(Data in me
- Page 195 and 196:
192APPENDIX AAbbreviations and Unit
- Page 197 and 198:
194Demonstrated.—A term for the s
- Page 199 and 200:
196Part B—Sources of Reserves Dat
- Page 201:
198Europe and Central Eurasia—con