PEAT115Events, Trends, <strong>and</strong> Issues: Peat is an important component of growing media, <strong>and</strong> the dem<strong>and</strong> for peat generallyfollows that of horticultural applications. In the United States, the short-term outlook is for production to average about600,000 tons per year <strong>and</strong> imported peat from Canada to account for more than 60% of domestic consumption.The Canadian peat industry had one of its best peat harvests in over the past 2 decades owing to the dry weather.The three major producing provinces—New Brunswick, Alberta, <strong>and</strong> Quebec—all had a strong production year.Indonesia announced plans for a 2-year moratorium on converting peatl<strong>and</strong>s into palm oil plantations in an effort toreduce greenhouse gas emissions. The United Kingdom plans a phaseout by 2020 of peat-based composts thatwould be sold in garden centers as a means of preserving peatl<strong>and</strong>s in that country.World Mine Production <strong>and</strong> Reserves: Countries that reported by volume only <strong>and</strong> had insufficient data forconversion to tons were combined <strong>and</strong> included with “Other countries.”Mine production Reserves 52009 2010 eUnited States 609 612 150,000Belarus 2,600 2,600 400,000Canada 1,130 1,280 720,000Estonia 828 830 60,000Finl<strong>and</strong> 9,100 6,700 6,000,000Irel<strong>and</strong> 4,300 4,300 ( 6 )Latvia 1,000 1,000 76,000Lithuania 536 530 190,000Moldova 475 475 ( 6 )Russia 1,300 1,300 1,000,000Sweden 1,280 1,280 ( 6 )Ukraine 360 450 ( 6 )Other countries 1,460 1,4601,400,000World total (rounded) 25,000 23,000 10,000,000World Resources: Peat is a renewable resource, continuing to accumulate on 60% of global peatl<strong>and</strong>s. However,the volume of global peatl<strong>and</strong>s has been decreasing at a rate of 0.05% annually owing to harvesting <strong>and</strong> l<strong>and</strong>development. Many countries evaluate peat resources based on volume or area because the variations in densities<strong>and</strong> thickness of peat deposits make it difficult to estimate tonnage. Volume data have been converted using theaverage bulk density of peat produced in that country. Reserves data were estimated based on data fromInternational Peat Society publications <strong>and</strong> the percentage of peat resources available for peat extraction. More than50% of the U.S. peatl<strong>and</strong>s are located in undisturbed areas of Alaska. Total world resources of peat were estimatedto be between 5 trillion <strong>and</strong> 6 trillion tons, covering about 400 million hectares. 7Substitutes: Natural organic materials such as composted yard waste <strong>and</strong> coir (coconut fiber) compete with peat inhorticultural applications. Shredded paper <strong>and</strong> straw are used to hold moisture for some grass-seeding applications.The superior water-holding capacity <strong>and</strong> physiochemical properties of peat limit substitution alternatives.e Estimated.1 See Appendix A for conversion to short tons.2 Hughes, R.A., Szumigala, D.J., <strong>and</strong> Harbo, L.A., 2010, Alaska’s mineral industry 2009—A summary: Alaska Department of Natural ResourcesInformation Circular 60, 15 p.3 Defined as production + imports – exports + adjustments for industry stock changes.4 Defined as imports – exports + adjustments for Government <strong>and</strong> industry stock changes.5 See Appendix C for resource/reserve definitions <strong>and</strong> information concerning data sources.6 Included with “Other countries.”7 Lappalainen, Eino, 1996, Global peat resources: Jyvaskyla, Finl<strong>and</strong>, International Peat Society, p. 55.U.S. Geological Survey, <strong>Mineral</strong> <strong>Commodity</strong> <strong>Summaries</strong>, January <strong>2011</strong>
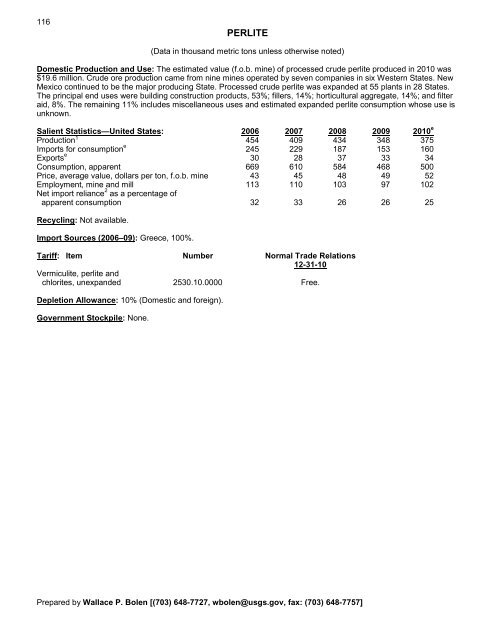
116PERLITE(Data in thous<strong>and</strong> metric tons unless otherwise noted)Domestic Production <strong>and</strong> Use: The estimated value (f.o.b. mine) of processed crude perlite produced in 2010 was$19.6 million. Crude ore production came from nine mines operated by seven companies in six Western States. NewMexico continued to be the major producing State. Processed crude perlite was exp<strong>and</strong>ed at 55 plants in 28 States.The principal end uses were building construction products, 53%; fillers, 14%; horticultural aggregate, 14%; <strong>and</strong> filteraid, 8%. The remaining 11% includes miscellaneous uses <strong>and</strong> estimated exp<strong>and</strong>ed perlite consumption whose use isunknown.Salient Statistics—United States: 2006 2007 2008 2009 2010 eProduction 1 454 409 434 348 375Imports for consumption e 245 229 187 153 160Exports e 30 28 37 33 34Consumption, apparent 669 610 584 468 500Price, average value, dollars per ton, f.o.b. mine 43 45 48 49 52Employment, mine <strong>and</strong> mill 113 110 103 97 102Net import reliance 2 as a percentage ofapparent consumption 32 33 26 26 25Recycling: Not available.Import Sources (2006–09): Greece, 100%.Tariff: Item Number Normal Trade Relations12-31-10Vermiculite, perlite <strong>and</strong>chlorites, unexp<strong>and</strong>ed 2530.10.0000 Free.Depletion Allowance: 10% (Domestic <strong>and</strong> foreign).Government Stockpile: None.Prepared by Wallace P. Bolen [(703) 648-7727, wbolen@usgs.gov, fax: (703) 648-7757]
- Page 3:
U.S. Department of the InteriorKEN
- Page 6 and 7:
INTRODUCTION3Each chapter of the 20
- Page 8 and 9:
5NET EXPORTS OF MINERALRAW MATERIAL
- Page 10 and 11:
SIGNIFICANT EVENTS, TRENDS, AND ISS
- Page 12 and 13:
mineral materials valued at $1.30 b
- Page 14 and 15:
11MAJOR METAL-PRODUCING AREASAuB2P1
- Page 16 and 17:
13MAJOR INDUSTRIAL MINERAL-PRODUCIN
- Page 18 and 19:
ABRASIVES (MANUFACTURED)15Events, T
- Page 20 and 21:
ALUMINUM17The United States continu
- Page 22 and 23:
ANTIMONY19Events, Trends, and Issue
- Page 24 and 25:
ARSENIC21According to university me
- Page 26 and 27:
ASBESTOS23Events, Trends, and Issue
- Page 28 and 29:
BARITE25Nationally, the rig count o
- Page 30 and 31:
BAUXITE AND ALUMINA27Events, Trends
- Page 32 and 33:
BERYLLIUM29Events, Trends, and Issu
- Page 34 and 35:
BISMUTH31Events, Trends, and Issues
- Page 36 and 37:
BORON33Events, Trends, and Issues:
- Page 38 and 39:
BROMINE35Events, Trends, and Issues
- Page 40 and 41:
CADMIUM37NiCd battery use in consum
- Page 42 and 43:
CEMENT39The manufacture of clinker
- Page 44 and 45:
CESIUM41Events, Trends, and Issues:
- Page 46 and 47:
CHROMIUM43Stockpile Status—9-30-1
- Page 48 and 49:
CLAYS45Tariff: Item Number Normal T
- Page 50 and 51:
COBALT47Events, Trends, and Issues:
- Page 52 and 53:
COPPER49Events, Trends, and Issues:
- Page 54 and 55:
DIAMOND (INDUSTRIAL)51Events, Trend
- Page 56 and 57:
DIATOMITE53Events, Trends, and Issu
- Page 58 and 59:
FELDSPAR55Feldspar use in tile and
- Page 60 and 61:
FLUORSPAR57with planned output of 1
- Page 62 and 63:
GALLIUM59In response to the unprece
- Page 64 and 65:
GARNET (INDUSTRIAL)61Events, Trends
- Page 66 and 67:
GEMSTONES63Events, Trends, and Issu
- Page 68 and 69: GERMANIUM65Events, Trends, and Issu
- Page 70 and 71: GOLD67With the increase in price of
- Page 72 and 73: GRAPHITE (NATURAL)69Events, Trends,
- Page 74 and 75: GYPSUM71Through 2010, more than 3,6
- Page 76 and 77: HELIUM73Events, Trends, and Issues:
- Page 78 and 79: INDIUM75China’s 21 indium produce
- Page 80 and 81: IODINE77Events, Trends, and Issues:
- Page 82 and 83: IRON AND STEEL79Events, Trends, and
- Page 84 and 85: IRON AND STEEL SCRAP81Tariff: Item
- Page 86 and 87: IRON AND STEEL SLAG83Events, Trends
- Page 88 and 89: IRON ORE85In 2009, China imported a
- Page 90 and 91: IRON OXIDE PIGMENTS87Events, Trends
- Page 92 and 93: KYANITE AND RELATED MATERIALS89Even
- Page 94 and 95: LEAD91caused by underground fires a
- Page 96 and 97: LIME93The lime industry is facing p
- Page 98 and 99: LITHIUM95market, and a facility at
- Page 100 and 101: MAGNESIUM COMPOUNDS97In Australia,
- Page 102 and 103: MAGNESIUM METAL99U.S. magnesium con
- Page 104 and 105: MANGANESE101Government Stockpile:St
- Page 106 and 107: MERCURY103Events, Trends, and Issue
- Page 108 and 109: MICA (NATURAL)105Depletion Allowanc
- Page 110 and 111: MOLYBDENUM107Events, Trends, and Is
- Page 112 and 113: NICKEL109Nickel prices were adverse
- Page 114 and 115: NIOBIUM (COLUMBIUM)111Events, Trend
- Page 116 and 117: NITROGEN (FIXED)—AMMONIA113Accord
- Page 120 and 121: PERLITE117Events, Trends, and Issue
- Page 122 and 123: PHOSPHATE ROCK119Events, Trends, an
- Page 124 and 125: PLATINUM-GROUP METALS121Events, Tre
- Page 126 and 127: POTASH123Events, Trends, and Issues
- Page 128 and 129: PUMICE AND PUMICITE125Events, Trend
- Page 130 and 131: QUARTZ CRYSTAL (INDUSTRIAL)127Event
- Page 132 and 133: RARE EARTHS129Events, Trends, and I
- Page 134 and 135: RHENIUM131Events, Trends, and Issue
- Page 136 and 137: RUBIDIUM133Events, Trends, and Issu
- Page 138 and 139: SALT135Many chefs have advocated us
- Page 140 and 141: SAND AND GRAVEL (CONSTRUCTION)137Ev
- Page 142 and 143: SAND AND GRAVEL (INDUSTRIAL)139The
- Page 144 and 145: SCANDIUM141Scandium’s use in meta
- Page 146 and 147: SELENIUM143Events, Trends, and Issu
- Page 148 and 149: SILICON145Events, Trends, and Issue
- Page 150 and 151: SILVER147Silver was used as a repla
- Page 152 and 153: SODA ASH149A Wyoming soda ash produ
- Page 154 and 155: SODIUM SULFATE151Events, Trends, an
- Page 156 and 157: STONE (CRUSHED)153Events, Trends, a
- Page 158 and 159: STONE (DIMENSION)155Events, Trends,
- Page 160 and 161: STRONTIUM157Events, Trends, and Iss
- Page 162 and 163: SULFUR159World sulfur production in
- Page 164 and 165: TALC AND PYROPHYLLITE161Events, Tre
- Page 166 and 167: TANTALUM163Events, Trends, and Issu
- Page 168 and 169:
TELLURIUM165Events, Trends, and Iss
- Page 170:
THALLIUM167Beginning in 2009, there
- Page 173 and 174:
170TIN(Data in metric tons of tin c
- Page 175 and 176:
172TITANIUM AND TITANIUM DIOXIDE 1(
- Page 177 and 178:
174TITANIUM MINERAL CONCENTRATES 1(
- Page 179 and 180:
176TUNGSTEN(Data in metric tons of
- Page 181 and 182:
178VANADIUM(Data in metric tons of
- Page 183 and 184:
180VERMICULITE(Data in thousand met
- Page 185 and 186:
182WOLLASTONITE(Data in metric tons
- Page 187 and 188:
184YTTRIUM 1(Data in metric tons of
- Page 189 and 190:
186ZEOLITES (NATURAL)(Data in metri
- Page 191 and 192:
188ZINC(Data in thousand metric ton
- Page 193 and 194:
190ZIRCONIUM AND HAFNIUM(Data in me
- Page 195 and 196:
192APPENDIX AAbbreviations and Unit
- Page 197 and 198:
194Demonstrated.—A term for the s
- Page 199 and 200:
196Part B—Sources of Reserves Dat
- Page 201:
198Europe and Central Eurasia—con