TUNGSTEN177Government Stockpile:Stockpile Status—9-30-10 6Uncommitted Authorized Disposal plan DisposalsMaterial inventory for disposal FY 2010 FY 2010Metal powder 171 171 136 —Ores <strong>and</strong> concentrates 17,000 17,000 3,630 2,670Events, Trends, <strong>and</strong> Issues: World tungsten supply is dominated by Chinese production <strong>and</strong> exports. China’sGovernment regulates its tungsten industry by limiting the number of exploration, mining, <strong>and</strong> export licenses; limitingor forbidding foreign investment; imposing constraints on mining <strong>and</strong> processing; establishing quotas on production<strong>and</strong> exports; adjusting export quotas to favor value-added downstream materials <strong>and</strong> products; <strong>and</strong> imposing exporttaxes on tungsten materials. China is the world’s largest tungsten consumer. To conserve its resources <strong>and</strong> meetincreasing domestic dem<strong>and</strong>, the Chinese Government was expected to continue to limit tungsten production <strong>and</strong>exports <strong>and</strong> to increase imports of tungsten. In addition, the Chinese tungsten industry was investing in miningprojects outside of China <strong>and</strong> increasing its use of tungsten scrap.In 2010, global economic conditions improved <strong>and</strong> tungsten consumption increased compared with the low levels of2009. The sole Canadian tungsten mine restarted production in October 2010 after being on care-<strong>and</strong>-maintenancestatus for 1 year. By November, a combination of recovering dem<strong>and</strong>, Chinese controls on production <strong>and</strong> exports,<strong>and</strong> a temporary suspension of tungsten sales from Defense Logistics Agency, DLA Strategic Materials (formerlyDefense National Stockpile Center) resulted in tightening supplies of concentrates <strong>and</strong> increased prices.In recent years, the tungsten industry has increased its monitoring of proposed legislation <strong>and</strong> scientific researchregarding the impact of tungsten on human health <strong>and</strong> the environment.World Mine Production <strong>and</strong> Reserves: Reserves for Canada were revised upward based on company data;reserves for China were revised upward based on new information from that country.Mine production Reserves 72009 2010 eUnited States W W 140,000Austria 900 1,000 10,000Bolivia 1,000 1,100 53,000Canada 2,000 300 120,000China 51,000 52,000 1,900,000Portugal 900 950 4,200Russia 2,500 2,500 250,000Other countries 3,000 3,300400,000World total (rounded)61,30061,000 2,900,000World Resources: World tungsten resources are geographically widespread. China ranks first in the world in termsof tungsten resources <strong>and</strong> reserves <strong>and</strong> has some of the largest deposits. Canada, Kazakhstan, Russia, <strong>and</strong> theUnited States also have significant tungsten resources.Substitutes: Potential substitutes for cemented tungsten carbides include cemented carbides based on molybdenumcarbide <strong>and</strong> titanium carbide, ceramics, ceramic-metallic composites (cermets), diamond tools, <strong>and</strong> tool steels.Potential substitutes for other applications are as follows: molybdenum for certain tungsten mill products;molybdenum steels for tungsten steels; lighting based on carbon nanotube filaments, induction technology, <strong>and</strong> lightemittingdiodes for lighting based on tungsten electrodes or filaments; depleted uranium for tungsten alloys orunalloyed tungsten in weights <strong>and</strong> counterweights; <strong>and</strong> depleted uranium alloys for cemented tungsten carbides ortungsten alloys in armor-piercing projectiles. In some applications, substitution would result in increased cost or a lossin product performance.e Estimated. W Withheld to avoid disclosing company proprietary data. — Zero.1 The sum of U.S. net import reliance <strong>and</strong> secondary production, as estimated from scrap consumption.2 Excludes U.S. production.3 A metric ton unit (mtu) of tungsten trioxide (WO 3) contains 7.93 kilograms of tungsten.4 Defined as imports – exports + adjustments for Government <strong>and</strong> industry stock changes.5 No tariff for Canada <strong>and</strong> Mexico. Tariffs for other countries for some items may be eliminated under special trade agreements.6 See Appendix B for definitions.7 See Appendix C for resource/reserve definitions <strong>and</strong> information concerning data sources.U.S. Geological Survey, <strong>Mineral</strong> <strong>Commodity</strong> <strong>Summaries</strong>, January <strong>2011</strong>
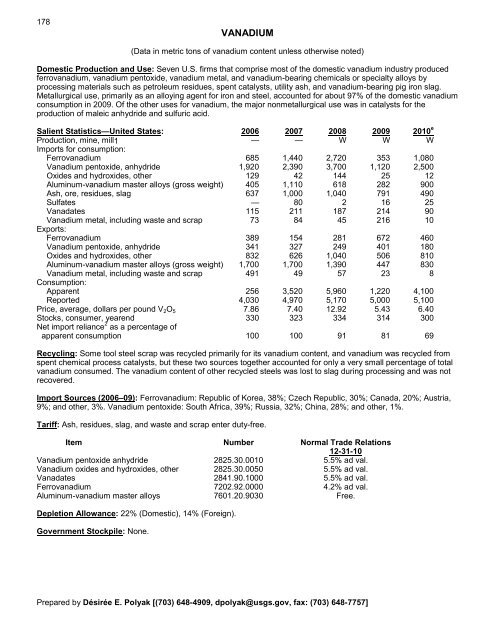
178VANADIUM(Data in metric tons of vanadium content unless otherwise noted)Domestic Production <strong>and</strong> Use: Seven U.S. firms that comprise most of the domestic vanadium industry producedferrovanadium, vanadium pentoxide, vanadium metal, <strong>and</strong> vanadium-bearing chemicals or specialty alloys byprocessing materials such as petroleum residues, spent catalysts, utility ash, <strong>and</strong> vanadium-bearing pig iron slag.Metallurgical use, primarily as an alloying agent for iron <strong>and</strong> steel, accounted for about 97% of the domestic vanadiumconsumption in 2009. Of the other uses for vanadium, the major nonmetallurgical use was in catalysts for theproduction of maleic anhydride <strong>and</strong> sulfuric acid.Salient Statistics—United States: 2006 2007 2008 2009 2010 eProduction, mine, mill1 — — W W WImports for consumption:Ferrovanadium 685 1,440 2,720 353 1,080Vanadium pentoxide, anhydride 1,920 2,390 3,700 1,120 2,500Oxides <strong>and</strong> hydroxides, other 129 42 144 25 12Aluminum-vanadium master alloys (gross weight) 405 1,110 618 282 900Ash, ore, residues, slag 637 1,000 1,040 791 490Sulfates — 80 2 16 25Vanadates 115 211 187 214 90Vanadium metal, including waste <strong>and</strong> scrap 73 84 45 216 10Exports:Ferrovanadium 389 154 281 672 460Vanadium pentoxide, anhydride 341 327 249 401 180Oxides <strong>and</strong> hydroxides, other 832 626 1,040 506 810Aluminum-vanadium master alloys (gross weight) 1,700 1,700 1,390 447 830Vanadium metal, including waste <strong>and</strong> scrap 491 49 57 23 8Consumption:Apparent 256 3,520 5,960 1,220 4,100Reported 4,030 4,970 5,170 5,000 5,100Price, average, dollars per pound V 2 O 5 7.86 7.40 12.92 5.43 6.40Stocks, consumer, yearend 330 323 334 314 300Net import reliance 2 as a percentage ofapparent consumption 100 100 91 81 69Recycling: Some tool steel scrap was recycled primarily for its vanadium content, <strong>and</strong> vanadium was recycled fromspent chemical process catalysts, but these two sources together accounted for only a very small percentage of totalvanadium consumed. The vanadium content of other recycled steels was lost to slag during processing <strong>and</strong> was notrecovered.Import Sources (2006–09): Ferrovanadium: Republic of Korea, 38%; Czech Republic, 30%; Canada, 20%; Austria,9%; <strong>and</strong> other, 3%. Vanadium pentoxide: South Africa, 39%; Russia, 32%; China, 28%; <strong>and</strong> other, 1%.Tariff: Ash, residues, slag, <strong>and</strong> waste <strong>and</strong> scrap enter duty-free.Item Number Normal Trade Relations12-31-10Vanadium pentoxide anhydride 2825.30.0010 5.5% ad val.Vanadium oxides <strong>and</strong> hydroxides, other 2825.30.0050 5.5% ad val.Vanadates 2841.90.1000 5.5% ad val.Ferrovanadium 7202.92.0000 4.2% ad val.Aluminum-vanadium master alloys 7601.20.9030 Free.Depletion Allowance: 22% (Domestic), 14% (Foreign).Government Stockpile: None.Prepared by Désirée E. Polyak [(703) 648-4909, dpolyak@usgs.gov, fax: (703) 648-7757]
- Page 3:
U.S. Department of the InteriorKEN
- Page 6 and 7:
INTRODUCTION3Each chapter of the 20
- Page 8 and 9:
5NET EXPORTS OF MINERALRAW MATERIAL
- Page 10 and 11:
SIGNIFICANT EVENTS, TRENDS, AND ISS
- Page 12 and 13:
mineral materials valued at $1.30 b
- Page 14 and 15:
11MAJOR METAL-PRODUCING AREASAuB2P1
- Page 16 and 17:
13MAJOR INDUSTRIAL MINERAL-PRODUCIN
- Page 18 and 19:
ABRASIVES (MANUFACTURED)15Events, T
- Page 20 and 21:
ALUMINUM17The United States continu
- Page 22 and 23:
ANTIMONY19Events, Trends, and Issue
- Page 24 and 25:
ARSENIC21According to university me
- Page 26 and 27:
ASBESTOS23Events, Trends, and Issue
- Page 28 and 29:
BARITE25Nationally, the rig count o
- Page 30 and 31:
BAUXITE AND ALUMINA27Events, Trends
- Page 32 and 33:
BERYLLIUM29Events, Trends, and Issu
- Page 34 and 35:
BISMUTH31Events, Trends, and Issues
- Page 36 and 37:
BORON33Events, Trends, and Issues:
- Page 38 and 39:
BROMINE35Events, Trends, and Issues
- Page 40 and 41:
CADMIUM37NiCd battery use in consum
- Page 42 and 43:
CEMENT39The manufacture of clinker
- Page 44 and 45:
CESIUM41Events, Trends, and Issues:
- Page 46 and 47:
CHROMIUM43Stockpile Status—9-30-1
- Page 48 and 49:
CLAYS45Tariff: Item Number Normal T
- Page 50 and 51:
COBALT47Events, Trends, and Issues:
- Page 52 and 53:
COPPER49Events, Trends, and Issues:
- Page 54 and 55:
DIAMOND (INDUSTRIAL)51Events, Trend
- Page 56 and 57:
DIATOMITE53Events, Trends, and Issu
- Page 58 and 59:
FELDSPAR55Feldspar use in tile and
- Page 60 and 61:
FLUORSPAR57with planned output of 1
- Page 62 and 63:
GALLIUM59In response to the unprece
- Page 64 and 65:
GARNET (INDUSTRIAL)61Events, Trends
- Page 66 and 67:
GEMSTONES63Events, Trends, and Issu
- Page 68 and 69:
GERMANIUM65Events, Trends, and Issu
- Page 70 and 71:
GOLD67With the increase in price of
- Page 72 and 73:
GRAPHITE (NATURAL)69Events, Trends,
- Page 74 and 75:
GYPSUM71Through 2010, more than 3,6
- Page 76 and 77:
HELIUM73Events, Trends, and Issues:
- Page 78 and 79:
INDIUM75China’s 21 indium produce
- Page 80 and 81:
IODINE77Events, Trends, and Issues:
- Page 82 and 83:
IRON AND STEEL79Events, Trends, and
- Page 84 and 85:
IRON AND STEEL SCRAP81Tariff: Item
- Page 86 and 87:
IRON AND STEEL SLAG83Events, Trends
- Page 88 and 89:
IRON ORE85In 2009, China imported a
- Page 90 and 91:
IRON OXIDE PIGMENTS87Events, Trends
- Page 92 and 93:
KYANITE AND RELATED MATERIALS89Even
- Page 94 and 95:
LEAD91caused by underground fires a
- Page 96 and 97:
LIME93The lime industry is facing p
- Page 98 and 99:
LITHIUM95market, and a facility at
- Page 100 and 101:
MAGNESIUM COMPOUNDS97In Australia,
- Page 102 and 103:
MAGNESIUM METAL99U.S. magnesium con
- Page 104 and 105:
MANGANESE101Government Stockpile:St
- Page 106 and 107:
MERCURY103Events, Trends, and Issue
- Page 108 and 109:
MICA (NATURAL)105Depletion Allowanc
- Page 110 and 111:
MOLYBDENUM107Events, Trends, and Is
- Page 112 and 113:
NICKEL109Nickel prices were adverse
- Page 114 and 115:
NIOBIUM (COLUMBIUM)111Events, Trend
- Page 116 and 117:
NITROGEN (FIXED)—AMMONIA113Accord
- Page 118 and 119:
PEAT115Events, Trends, and Issues:
- Page 120 and 121:
PERLITE117Events, Trends, and Issue
- Page 122 and 123:
PHOSPHATE ROCK119Events, Trends, an
- Page 124 and 125:
PLATINUM-GROUP METALS121Events, Tre
- Page 126 and 127:
POTASH123Events, Trends, and Issues
- Page 128 and 129:
PUMICE AND PUMICITE125Events, Trend
- Page 130 and 131: QUARTZ CRYSTAL (INDUSTRIAL)127Event
- Page 132 and 133: RARE EARTHS129Events, Trends, and I
- Page 134 and 135: RHENIUM131Events, Trends, and Issue
- Page 136 and 137: RUBIDIUM133Events, Trends, and Issu
- Page 138 and 139: SALT135Many chefs have advocated us
- Page 140 and 141: SAND AND GRAVEL (CONSTRUCTION)137Ev
- Page 142 and 143: SAND AND GRAVEL (INDUSTRIAL)139The
- Page 144 and 145: SCANDIUM141Scandium’s use in meta
- Page 146 and 147: SELENIUM143Events, Trends, and Issu
- Page 148 and 149: SILICON145Events, Trends, and Issue
- Page 150 and 151: SILVER147Silver was used as a repla
- Page 152 and 153: SODA ASH149A Wyoming soda ash produ
- Page 154 and 155: SODIUM SULFATE151Events, Trends, an
- Page 156 and 157: STONE (CRUSHED)153Events, Trends, a
- Page 158 and 159: STONE (DIMENSION)155Events, Trends,
- Page 160 and 161: STRONTIUM157Events, Trends, and Iss
- Page 162 and 163: SULFUR159World sulfur production in
- Page 164 and 165: TALC AND PYROPHYLLITE161Events, Tre
- Page 166 and 167: TANTALUM163Events, Trends, and Issu
- Page 168 and 169: TELLURIUM165Events, Trends, and Iss
- Page 170: THALLIUM167Beginning in 2009, there
- Page 173 and 174: 170TIN(Data in metric tons of tin c
- Page 175 and 176: 172TITANIUM AND TITANIUM DIOXIDE 1(
- Page 177 and 178: 174TITANIUM MINERAL CONCENTRATES 1(
- Page 179: 176TUNGSTEN(Data in metric tons of
- Page 183 and 184: 180VERMICULITE(Data in thousand met
- Page 185 and 186: 182WOLLASTONITE(Data in metric tons
- Page 187 and 188: 184YTTRIUM 1(Data in metric tons of
- Page 189 and 190: 186ZEOLITES (NATURAL)(Data in metri
- Page 191 and 192: 188ZINC(Data in thousand metric ton
- Page 193 and 194: 190ZIRCONIUM AND HAFNIUM(Data in me
- Page 195 and 196: 192APPENDIX AAbbreviations and Unit
- Page 197 and 198: 194Demonstrated.—A term for the s
- Page 199 and 200: 196Part B—Sources of Reserves Dat
- Page 201: 198Europe and Central Eurasia—con