Offshore Electricity Infrastructure in Europe - European Wind Energy ...
Offshore Electricity Infrastructure in Europe - European Wind Energy ...
Offshore Electricity Infrastructure in Europe - European Wind Energy ...

Create successful ePaper yourself
Turn your PDF publications into a flip-book with our unique Google optimized e-Paper software.
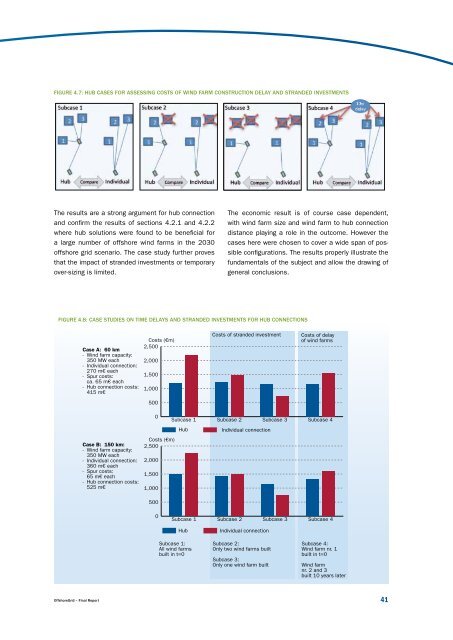
FIGURE 4.7: hUb cASES FOR ASSESSING cOSTS OF WINd FARM cONSTRUcTION dElAY ANd STRANdEd INvESTMENTS<br />
The results are a strong argument for hub connection<br />
and confirm the results of sections 4.2.1 and 4.2.2<br />
where hub solutions were found to be beneficial for<br />
a large number of offshore w<strong>in</strong>d farms <strong>in</strong> the 2030<br />
offshore grid scenario. The case study further proves<br />
that the impact of stranded <strong>in</strong>vestments or temporary<br />
over-siz<strong>in</strong>g is limited.<br />
FIGURE 4.8: cASE STUdIES ON TIME dElAYS ANd STRANdEd INvESTMENTS FOR hUb cONNEcTIONS<br />
<strong>Offshore</strong>Grid – F<strong>in</strong>al Report<br />
Case A: 60 km<br />
- W<strong>in</strong>d farm capacity:<br />
350 MW each<br />
- Individual connection:<br />
270 m€ each<br />
- Spur costs:<br />
ca. 65 m€ each<br />
- Hub connection costs:<br />
415 m€<br />
Case B: 150 km:<br />
- W<strong>in</strong>d farm capacity:<br />
350 MW each<br />
- Individual connection:<br />
360 m€ each<br />
- Spur costs:<br />
65 m€ each<br />
- Hub connection costs:<br />
525 m€<br />
Costs (€m)<br />
2,500<br />
2,000<br />
1,500<br />
1,000<br />
500<br />
0<br />
Costs (€m)<br />
2,500<br />
2,000<br />
1,500<br />
1,000<br />
500<br />
0<br />
Subcase 1<br />
Hub<br />
Subcase 1<br />
Hub<br />
Subcase 1:<br />
All w<strong>in</strong>d farms<br />
built <strong>in</strong> t=0<br />
The economic result is of course case dependent,<br />
with w<strong>in</strong>d farm size and w<strong>in</strong>d farm to hub connection<br />
distance play<strong>in</strong>g a role <strong>in</strong> the outcome. However the<br />
cases here were chosen to cover a wide span of possible<br />
configurations. The results properly illustrate the<br />
fundamentals of the subject and allow the draw<strong>in</strong>g of<br />
general conclusions.<br />
Costs of stranded <strong>in</strong>vestment Costs of delay<br />
of w<strong>in</strong>d farms<br />
Subcase 2<br />
Individual connection<br />
Subcase 2<br />
Individual connection<br />
Subcase 2:<br />
Only two w<strong>in</strong>d farms built<br />
Subcase 3:<br />
Only one w<strong>in</strong>d farm built<br />
Subcase 3<br />
Subcase 3<br />
Subcase 4<br />
Subcase 4<br />
Subcase 4:<br />
W<strong>in</strong>d farm nr. 1<br />
built <strong>in</strong> t=0<br />
W<strong>in</strong>d farm<br />
nr. 2 and 3<br />
built 10 years later<br />
41