Offshore Electricity Infrastructure in Europe - European Wind Energy ...
Offshore Electricity Infrastructure in Europe - European Wind Energy ...
Offshore Electricity Infrastructure in Europe - European Wind Energy ...

Create successful ePaper yourself
Turn your PDF publications into a flip-book with our unique Google optimized e-Paper software.
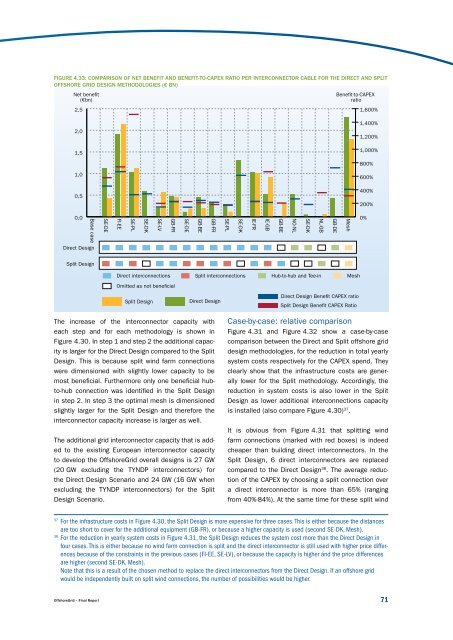
FIGURE 4.33: cOMPARISON OF NET bENEFIT ANd bENEFIT-TO-cAPEX RATIO PER INTERcONNEcTOR cAblE FOR ThE dIREcT ANd SPlIT<br />
OFFShORE GRId dESIGN METhOdOlOGIES (€ bN)<br />
Net bene�t<br />
(€bn)<br />
2,5<br />
2,0<br />
1,5<br />
1,0<br />
0,5<br />
0,0<br />
Base case<br />
Direct Design<br />
Split Design<br />
The <strong>in</strong>crease of the <strong>in</strong>terconnector capacity with<br />
each step and for each methodology is shown <strong>in</strong><br />
Figure 4.30. In step 1 and step 2 the additional capacity<br />
is larger for the Direct Design compared to the Split<br />
Design. This is because split w<strong>in</strong>d farm connections<br />
were dimensioned with slightly lower capacity to be<br />
most beneficial. Furthermore only one beneficial hubto-hub<br />
connection was identified <strong>in</strong> the Split Design<br />
<strong>in</strong> step 2. In step 3 the optimal mesh is dimensioned<br />
slightly larger for the Split Design and therefore the<br />
<strong>in</strong>terconnector capacity <strong>in</strong>crease is larger as well.<br />
The additional grid <strong>in</strong>terconnector capacity that is added<br />
to the exist<strong>in</strong>g <strong>Europe</strong>an <strong>in</strong>terconnector capacity<br />
to develop the <strong>Offshore</strong>Grid overall designs is 27 GW<br />
(20 GW exclud<strong>in</strong>g the TYNDP <strong>in</strong>terconnectors) for<br />
the Direct Design Scenario and 24 GW (16 GW when<br />
exclud<strong>in</strong>g the TYNDP <strong>in</strong>terconnectors) for the Split<br />
Design Scenario.<br />
37 For the <strong>in</strong>frastructure costs <strong>in</strong> Figure 4.30, the Split Design is more expensive for three cases. This is either because the distances<br />
are too short to cover for the additional equipment (GB-FR), or because a higher capacity is used (second SE-DK, Mesh).<br />
38 For the reduction <strong>in</strong> yearly system costs <strong>in</strong> Figure 4.31, the Split Design reduces the system cost more than the Direct Design <strong>in</strong><br />
four cases. This is either because no w<strong>in</strong>d farm connection is split and the direct <strong>in</strong>terconnector is still used with higher price differences<br />
because of the constra<strong>in</strong>ts <strong>in</strong> the previous cases (FI-EE, SE-LV), or because the capacity is higher ánd the price differences<br />
are higher (second SE-DK, Mesh).<br />
Note that this is a result of the chosen method to replace the direct <strong>in</strong>terconnectors from the Direct Design. If an offshore grid<br />
would be <strong>in</strong>dependently built on split w<strong>in</strong>d connections, the number of possibilities would be higher.<br />
<strong>Offshore</strong>Grid – F<strong>in</strong>al Report<br />
SE-DE<br />
FI-EE<br />
SE-PL<br />
SE-DK<br />
SE-LV<br />
GB-FR<br />
SE-DE<br />
GB-BE<br />
GB-FR<br />
Split Design Direct Design<br />
SE-PL<br />
SE-DK<br />
IE-FR<br />
IE-GB<br />
GB-BE<br />
NO-NL<br />
SE-DK<br />
Bene�t-to-CAPEX<br />
ratio<br />
Direct <strong>in</strong>terconnections Split <strong>in</strong>terconnections Hub-to-hub and Tee-<strong>in</strong> Mesh<br />
Omitted as not bene�cial<br />
Case-by-case: relative comparison<br />
Figure 4.31 and Figure 4.32 show a case-by-case<br />
comparison between the Direct and Split offshore grid<br />
design methodologies, for the reduction <strong>in</strong> total yearly<br />
system costs respectively for the CAPEX spend. They<br />
clearly show that the <strong>in</strong>frastructure costs are generally<br />
lower for the Split methodology. Accord<strong>in</strong>gly, the<br />
reduction <strong>in</strong> system costs is also lower <strong>in</strong> the Split<br />
Design as lower additional <strong>in</strong>terconnections capacity<br />
is <strong>in</strong>stalled (also compare Figure 4.30) 37 .<br />
It is obvious from Figure 4.31 that splitt<strong>in</strong>g w<strong>in</strong>d<br />
farm connections (marked with red boxes) is <strong>in</strong>deed<br />
cheaper than build<strong>in</strong>g direct <strong>in</strong>terconnectors. In the<br />
Split Design, 6 direct <strong>in</strong>terconnectors are replaced<br />
compared to the Direct Design 38 . The average reduction<br />
of the CAPEX by choos<strong>in</strong>g a split connection over<br />
a direct <strong>in</strong>terconnector is more than 65% (rang<strong>in</strong>g<br />
from 40%-84%). At the same time for these split w<strong>in</strong>d<br />
NL-GB<br />
GB-DE<br />
Mesh<br />
Direct Design Bene�t CAPEX ratio<br />
Split Design Bene�t CAPEX Ratio<br />
1,600%<br />
1,400%<br />
1,200%<br />
1,000%<br />
800%<br />
600%<br />
400%<br />
200%<br />
0%<br />
71