Chromosome segregation errors: a double-edged sword - TI Pharma
Chromosome segregation errors: a double-edged sword - TI Pharma
Chromosome segregation errors: a double-edged sword - TI Pharma

You also want an ePaper? Increase the reach of your titles
YUMPU automatically turns print PDFs into web optimized ePapers that Google loves.
5<br />
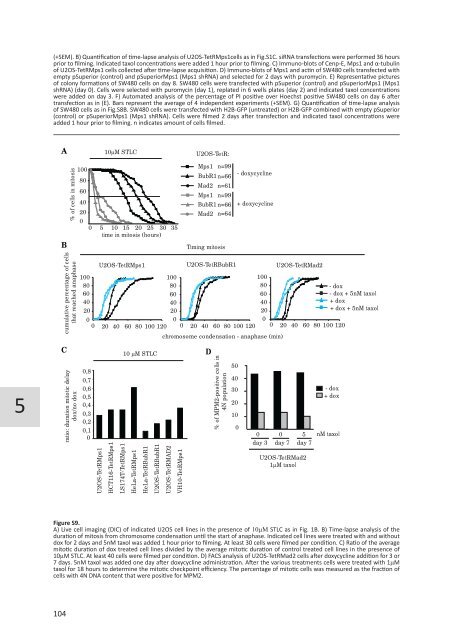
(+SEM). B) Quantification of time-lapse analysis of U2OS-TetRMps1cells as in Fig.S1C. siRNA transfections were performed 36 hours<br />
prior to filming. Indicated taxol concentrations were added 1 hour prior to filming. C) Immuno-blots of Cenp-E, Mps1 and α-tubulin<br />
of U2OS-TetRMps1 cells collected after time-lapse acquisition. D) Immuno-blots of Mps1 and actin of SW480 cells transfected with<br />
empty pSuperior (control) and pSuperiorMps1 (Mps1 shRNA) and selected for 2 days with puromycin. E) Representative pictures<br />
of colony formations of SW480 cells on day 8. SW480 cells were transfected with pSuperior (control) and pSuperiorMps1 (Mps1<br />
shRNA) (day 0). Cells were selected with puromycin (day 1), replated in 6 wells plates (day 2) and indicated taxol concentrations<br />
were added on day 3. F) Automated analysis of the percentage of PI positive over Hoechst positive SW480 cells on day 6 after<br />
transfection as in (E). Bars represent the average of 4 independent experiments (+SEM). G) Quantification of time-lapse analysis<br />
of SW480 cells as in Fig.S8B. SW480 cells were transfected with H2B-GFP (untreated) or H2B-GFP combined with empty pSuperior<br />
(control) or pSuperiorMps1 (Mps1 shRNA). Cells were filmed 2 days after transfection and indicated taxol concentrations were<br />
added 1 hour prior to filming. n indicates amount of cells filmed.<br />
A<br />
B<br />
C<br />
104<br />
% of cells in mitosis<br />
cumulative percentage of cells<br />
that reached anaphase<br />
ratio: duration mitotic delay<br />
dox/no dox<br />
100<br />
80<br />
60<br />
10µM STLC<br />
40<br />
20<br />
0<br />
0 5 10 15 20 25 30 35<br />
time in mitosis (hours)<br />
0,8<br />
0,7<br />
0,6<br />
0,5<br />
0,4<br />
0,3<br />
0,2<br />
0,1<br />
0<br />
U2OS-TetRMps1<br />
HCT116-TetRMps1<br />
LS174T-TetRMps1<br />
HeLa-TetRMps1<br />
HeLa-TetRBubR1<br />
U2OS-TetRBubR1<br />
U2OS-TetRMAD2<br />
VH10-TetRMps1<br />
U2OS-TetR:<br />
Mps1 n=99<br />
BubR1 n=66<br />
- doxycycline<br />
Mad2<br />
Mps1 n=99<br />
BubR1 n=66 + doxycycline<br />
Mad2 n=64<br />
Timing mitosis<br />
U2OS-TetRMps1 U2OS-TetRBubR1<br />
D<br />
U2OS-TetRMad2<br />
100<br />
100<br />
100<br />
80<br />
80<br />
80<br />
- dox<br />
60<br />
60<br />
60<br />
- dox + 5nM taxol<br />
40<br />
20<br />
40<br />
20<br />
40<br />
20<br />
+ dox<br />
+ dox + 5nM taxol<br />
0<br />
0 20 40 60 80 100 120<br />
0<br />
0 20 40 60 80 100 120<br />
0<br />
0 20 40 60 80 100 120<br />
chromosome condensation - anaphase (min)<br />
10 µM STLC<br />
n=61<br />
% of MPM2-positive cells in<br />
4N population<br />
50<br />
40<br />
30<br />
20<br />
10<br />
0<br />
U2OS-TetRMad2<br />
1µM taxol<br />
- dox<br />
+ dox<br />
0 0 5 nM taxol<br />
day 3 day 7 day 7<br />
Figure S9.<br />
A) Live cell imaging (DIC) of indicated U2OS cell lines in the presence of 10mM STLC as in Fig. 1B. B) Time-lapse analysis of the<br />
duration of mitosis from chromosome condensation until the start of anaphase. Indicated cell lines were treated with and without<br />
dox for 2 days and 5nM taxol was added 1 hour prior to filming. At least 30 cells were filmed per condition. C) Ratio of the average<br />
mitotic duration of dox treated cell lines divided by the average mitotic duration of control treated cell lines in the presence of<br />
10mM STLC. At least 40 cells were filmed per condition. D) FACS analysis of U2OS-TetRMad2 cells after doxycycline addition for 3 or<br />
7 days. 5nM taxol was added one day after doxycycline administration. After the various treatments cells were treated with 1mM<br />
taxol for 18 hours to determine the mitotic checkpoint efficiency. The percentage of mitotic cells was measured as the fraction of<br />
cells with 4N DNA content that were positive for MPM2.