

Foreign Direct Investment in Latin America and the Caribbean 2017
This publication sets out and analyses the main foreign direct investment (FDI) trends in the countries of Latin America and the Caribbean. The 2017 edition shows that the region is at a difficult juncture. FDI inflows declined by 7.9% in 2016, to US$ 167.043 billion, representing a cumulative fall of 17.0% since the peak in 2011. The fall in commodity prices continues to affect investments in natural resources, sluggish economic growth in several countries has slowed the flow of market-seeking capital, and the global backdrop of technological sophistication and expansion of the digital economy has concentrated transnational investments in developed economies.
This publication sets out and analyses the main foreign direct investment (FDI) trends in the countries of Latin America and the Caribbean. The 2017 edition shows that the region is at a difficult juncture. FDI inflows declined by 7.9% in 2016, to US$ 167.043 billion, representing a cumulative fall of 17.0% since the peak in 2011. The fall in commodity prices continues to affect investments in natural resources, sluggish economic growth in several countries has slowed the flow of market-seeking capital, and the global backdrop of technological sophistication and expansion of the digital economy has concentrated transnational investments in developed economies.

Create successful ePaper yourself
Turn your PDF publications into a flip-book with our unique Google optimized e-Paper software.
<strong>Foreign</strong> <strong>Direct</strong> <strong>Investment</strong> <strong>in</strong> Lat<strong>in</strong> <strong>America</strong> <strong>and</strong> <strong>the</strong> <strong>Caribbean</strong> • <strong>2017</strong><br />
Chapter II<br />
149<br />
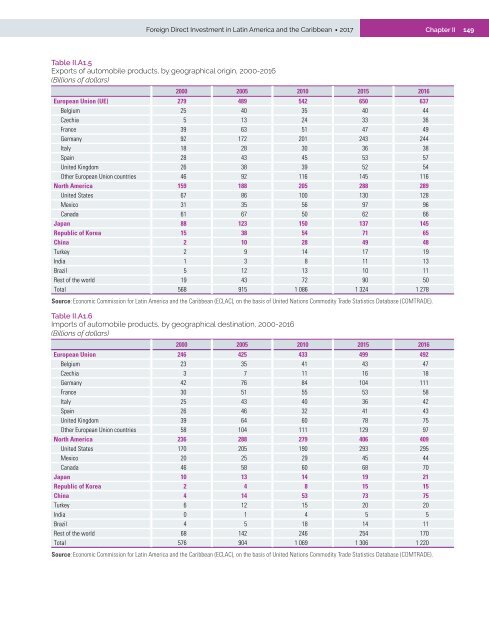
Table II.A1.5<br />
Exports of automobile products, by geographical orig<strong>in</strong>, 2000-2016<br />
(Billions of dollars)<br />
2000 2005 2010 2015 2016<br />
European Union (UE) 279 489 542 650 637<br />
Belgium 25 40 35 40 44<br />
Czechia 5 13 24 33 36<br />
France 39 63 51 47 49<br />
Germany 92 172 201 243 244<br />
Italy 18 28 30 36 38<br />
Spa<strong>in</strong> 28 43 45 53 57<br />
United K<strong>in</strong>gdom 26 38 39 52 54<br />
O<strong>the</strong>r European Union countries 46 92 116 145 116<br />
North <strong>America</strong> 159 188 205 288 289<br />
United States 67 86 100 130 128<br />
Mexico 31 35 56 97 96<br />
Canada 61 67 50 62 66<br />
Japan 88 123 150 137 145<br />
Republic of Korea 15 38 54 71 65<br />
Ch<strong>in</strong>a 2 10 28 49 48<br />
Turkey 2 9 14 17 19<br />
India 1 3 8 11 13<br />
Brazil 5 12 13 10 11<br />
Rest of <strong>the</strong> world 19 43 72 90 50<br />
Total 568 915 1 086 1 324 1 278<br />
Source: Economic Commission for Lat<strong>in</strong> <strong>America</strong> <strong>and</strong> <strong>the</strong> <strong>Caribbean</strong> (ECLAC), on <strong>the</strong> basis of United Nations Commodity Trade Statistics Database (COMTRADE).<br />
Table II.A1.6<br />
Imports of automobile products, by geographical dest<strong>in</strong>ation, 2000-2016<br />
(Billions of dollars)<br />
2000 2005 2010 2015 2016<br />
European Union 246 425 433 499 492<br />
Belgium 23 35 41 43 47<br />
Czechia 3 7 11 16 18<br />
Germany 42 76 84 104 111<br />
France 30 51 55 53 58<br />
Italy 25 43 40 36 42<br />
Spa<strong>in</strong> 26 46 32 41 43<br />
United K<strong>in</strong>gdom 39 64 60 78 75<br />
O<strong>the</strong>r European Union countries 58 104 111 129 97<br />
North <strong>America</strong> 236 288 279 406 409<br />
United States 170 205 190 293 295<br />
Mexico 20 25 29 45 44<br />
Canada 46 58 60 68 70<br />
Japan 10 13 14 19 21<br />
Republic of Korea 2 4 8 15 15<br />
Ch<strong>in</strong>a 4 14 53 73 75<br />
Turkey 6 12 15 20 20<br />
India 0 1 4 5 5<br />
Brazil 4 5 18 14 11<br />
Rest of <strong>the</strong> world 68 142 246 254 170<br />
Total 576 904 1 069 1 306 1 220<br />
Source: Economic Commission for Lat<strong>in</strong> <strong>America</strong> <strong>and</strong> <strong>the</strong> <strong>Caribbean</strong> (ECLAC), on <strong>the</strong> basis of United Nations Commodity Trade Statistics Database (COMTRADE).


