

Foreign Direct Investment in Latin America and the Caribbean 2017
This publication sets out and analyses the main foreign direct investment (FDI) trends in the countries of Latin America and the Caribbean. The 2017 edition shows that the region is at a difficult juncture. FDI inflows declined by 7.9% in 2016, to US$ 167.043 billion, representing a cumulative fall of 17.0% since the peak in 2011. The fall in commodity prices continues to affect investments in natural resources, sluggish economic growth in several countries has slowed the flow of market-seeking capital, and the global backdrop of technological sophistication and expansion of the digital economy has concentrated transnational investments in developed economies.
This publication sets out and analyses the main foreign direct investment (FDI) trends in the countries of Latin America and the Caribbean. The 2017 edition shows that the region is at a difficult juncture. FDI inflows declined by 7.9% in 2016, to US$ 167.043 billion, representing a cumulative fall of 17.0% since the peak in 2011. The fall in commodity prices continues to affect investments in natural resources, sluggish economic growth in several countries has slowed the flow of market-seeking capital, and the global backdrop of technological sophistication and expansion of the digital economy has concentrated transnational investments in developed economies.

Create successful ePaper yourself
Turn your PDF publications into a flip-book with our unique Google optimized e-Paper software.
26 Chapter I Economic Commission for Lat<strong>in</strong> <strong>America</strong> <strong>and</strong> <strong>the</strong> <strong>Caribbean</strong> (ECLAC)<br />
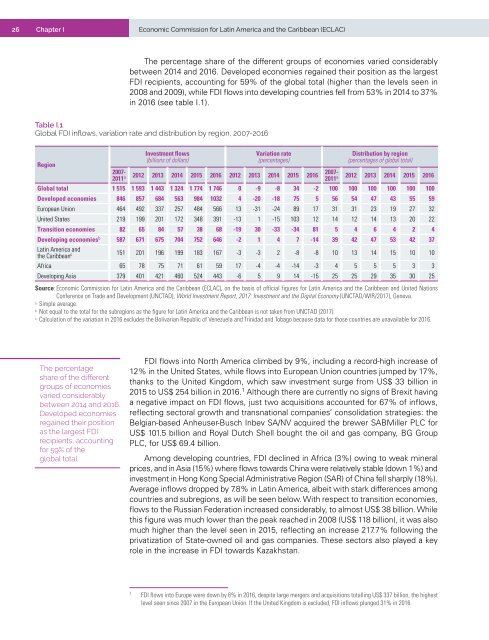
The percentage share of <strong>the</strong> different groups of economies varied considerably<br />
between 2014 <strong>and</strong> 2016. Developed economies rega<strong>in</strong>ed <strong>the</strong>ir position as <strong>the</strong> largest<br />
FDI recipients, account<strong>in</strong>g for 59% of <strong>the</strong> global total (higher than <strong>the</strong> levels seen <strong>in</strong><br />
2008 <strong>and</strong> 2009), while FDI flows <strong>in</strong>to develop<strong>in</strong>g countries fell from 53% <strong>in</strong> 2014 to 37%<br />
<strong>in</strong> 2016 (see table I.1).<br />
Table I.1<br />
Global FDI <strong>in</strong>flows, variation rate <strong>and</strong> distribution by region, 2007-2016<br />
<strong>Investment</strong> flows<br />
(billions of dollars)<br />
Variation rate<br />
(percentages)<br />
Distribution by region<br />
(percentages of global total)<br />
Region<br />
2007-<br />
2011 a 2012 2013 2014 2015 2016 2012 2013 2014 2015 2016<br />
2007-<br />
2011 a 2012 2013 2014 2015 2016<br />
Global total 1 515 1 593 1 443 1 324 1 774 1 746 0 -9 -8 34 -2 100 100 100 100 100 100<br />
Developed economies 846 857 684 563 984 1032 4 -20 -18 75 5 56 54 47 43 55 59<br />
European Union 464 492 337 257 484 566 13 -31 -24 89 17 31 31 23 19 27 32<br />
United States 219 199 201 172 348 391 -13 1 -15 103 12 14 12 14 13 20 22<br />
Transition economies 82 65 84 57 38 68 -19 30 -33 -34 81 5 4 6 4 2 4<br />
Develop<strong>in</strong>g economies b 587 671 675 704 752 646 -2 1 4 7 -14 39 42 47 53 42 37<br />
Lat<strong>in</strong> <strong>America</strong> <strong>and</strong><br />
<strong>the</strong> <strong>Caribbean</strong> c 151 201 196 199 183 167 -3 -3 2 -8 -8 10 13 14 15 10 10<br />
Africa 65 78 75 71 61 59 17 -4 -4 -14 -3 4 5 5 5 3 3<br />
Develop<strong>in</strong>g Asia 379 401 421 460 524 443 -6 5 9 14 -15 25 25 29 35 30 25<br />
Source: Economic Commission for Lat<strong>in</strong> <strong>America</strong> <strong>and</strong> <strong>the</strong> <strong>Caribbean</strong> (ECLAC), on <strong>the</strong> basis of official figures for Lat<strong>in</strong> <strong>America</strong> <strong>and</strong> <strong>the</strong> <strong>Caribbean</strong> <strong>and</strong> United Nations<br />
Conference on Trade <strong>and</strong> Development (UNCTAD), World <strong>Investment</strong> Report, <strong>2017</strong>: <strong>Investment</strong> <strong>and</strong> <strong>the</strong> Digital Economy (UNCTAD/WIR/<strong>2017</strong>), Geneva.<br />
a<br />
Simple average.<br />
b<br />
Not equal to <strong>the</strong> total for <strong>the</strong> subregions as <strong>the</strong> figure for Lat<strong>in</strong> <strong>America</strong> <strong>and</strong> <strong>the</strong> <strong>Caribbean</strong> is not taken from UNCTAD (<strong>2017</strong>).<br />
c<br />
Calculation of <strong>the</strong> variation <strong>in</strong> 2016 excludes <strong>the</strong> Bolivarian Republic of Venezuela <strong>and</strong> Tr<strong>in</strong>idad <strong>and</strong> Tobago because data for those countries are unavailable for 2016.<br />
The percentage<br />
share of <strong>the</strong> different<br />
groups of economies<br />
varied considerably<br />
between 2014 <strong>and</strong> 2016.<br />
Developed economies<br />
rega<strong>in</strong>ed <strong>the</strong>ir position<br />
as <strong>the</strong> largest FDI<br />
recipients, account<strong>in</strong>g<br />
for 59% of <strong>the</strong><br />
global total.<br />
FDI flows <strong>in</strong>to North <strong>America</strong> climbed by 9%, <strong>in</strong>clud<strong>in</strong>g a record-high <strong>in</strong>crease of<br />
12% <strong>in</strong> <strong>the</strong> United States, while flows <strong>in</strong>to European Union countries jumped by 17%,<br />
thanks to <strong>the</strong> United K<strong>in</strong>gdom, which saw <strong>in</strong>vestment surge from US$ 33 billion <strong>in</strong><br />
2015 to US$ 254 billion <strong>in</strong> 2016. 1 Although <strong>the</strong>re are currently no signs of Brexit hav<strong>in</strong>g<br />
a negative impact on FDI flows, just two acquisitions accounted for 67% of <strong>in</strong>flows,<br />
reflect<strong>in</strong>g sectoral growth <strong>and</strong> transnational companies’ consolidation strategies: <strong>the</strong><br />
Belgian-based Anheuser-Busch Inbev SA/NV acquired <strong>the</strong> brewer SABMiller PLC for<br />
US$ 101.5 billion <strong>and</strong> Royal Dutch Shell bought <strong>the</strong> oil <strong>and</strong> gas company, BG Group<br />
PLC, for US$ 69.4 billion.<br />
Among develop<strong>in</strong>g countries, FDI decl<strong>in</strong>ed <strong>in</strong> Africa (3%) ow<strong>in</strong>g to weak m<strong>in</strong>eral<br />
prices, <strong>and</strong> <strong>in</strong> Asia (15%) where flows towards Ch<strong>in</strong>a were relatively stable (down 1%) <strong>and</strong><br />
<strong>in</strong>vestment <strong>in</strong> Hong Kong Special Adm<strong>in</strong>istrative Region (SAR) of Ch<strong>in</strong>a fell sharply (18%).<br />
Average <strong>in</strong>flows dropped by 7.8% <strong>in</strong> Lat<strong>in</strong> <strong>America</strong>, albeit with stark differences among<br />
countries <strong>and</strong> subregions, as will be seen below. With respect to transition economies,<br />
flows to <strong>the</strong> Russian Federation <strong>in</strong>creased considerably, to almost US$ 38 billion. While<br />
this figure was much lower than <strong>the</strong> peak reached <strong>in</strong> 2008 (US$ 118 billion), it was also<br />
much higher than <strong>the</strong> level seen <strong>in</strong> 2015, reflect<strong>in</strong>g an <strong>in</strong>crease 217.7% follow<strong>in</strong>g <strong>the</strong><br />
privatization of State-owned oil <strong>and</strong> gas companies. These sectors also played a key<br />
role <strong>in</strong> <strong>the</strong> <strong>in</strong>crease <strong>in</strong> FDI towards Kazakhstan.<br />
1<br />
FDI flows <strong>in</strong>to Europe were down by 6% <strong>in</strong> 2016, despite large mergers <strong>and</strong> acquisitions totall<strong>in</strong>g US$ 337 billion, <strong>the</strong> highest<br />
level seen s<strong>in</strong>ce 2007 <strong>in</strong> <strong>the</strong> European Union. If <strong>the</strong> United K<strong>in</strong>gdom is excluded, FDI <strong>in</strong>flows plunged 31% <strong>in</strong> 2016.


