

Foreign Direct Investment in Latin America and the Caribbean 2017
This publication sets out and analyses the main foreign direct investment (FDI) trends in the countries of Latin America and the Caribbean. The 2017 edition shows that the region is at a difficult juncture. FDI inflows declined by 7.9% in 2016, to US$ 167.043 billion, representing a cumulative fall of 17.0% since the peak in 2011. The fall in commodity prices continues to affect investments in natural resources, sluggish economic growth in several countries has slowed the flow of market-seeking capital, and the global backdrop of technological sophistication and expansion of the digital economy has concentrated transnational investments in developed economies.
This publication sets out and analyses the main foreign direct investment (FDI) trends in the countries of Latin America and the Caribbean. The 2017 edition shows that the region is at a difficult juncture. FDI inflows declined by 7.9% in 2016, to US$ 167.043 billion, representing a cumulative fall of 17.0% since the peak in 2011. The fall in commodity prices continues to affect investments in natural resources, sluggish economic growth in several countries has slowed the flow of market-seeking capital, and the global backdrop of technological sophistication and expansion of the digital economy has concentrated transnational investments in developed economies.

Create successful ePaper yourself
Turn your PDF publications into a flip-book with our unique Google optimized e-Paper software.
178 Chapter III Economic Commission for Lat<strong>in</strong> <strong>America</strong> <strong>and</strong> <strong>the</strong> <strong>Caribbean</strong> (ECLAC)<br />
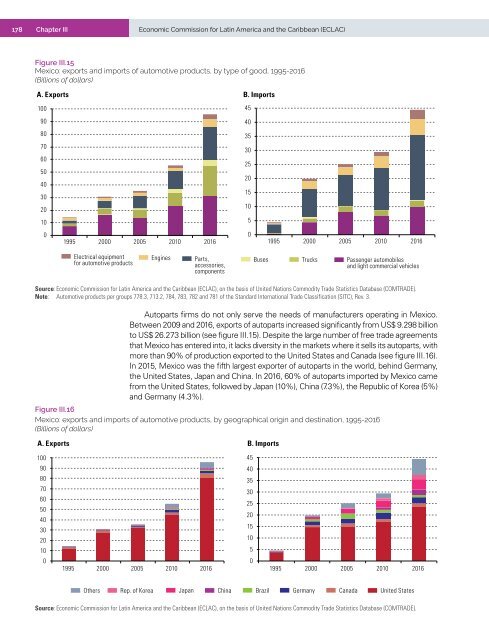
Figure III.15<br />
Mexico: exports <strong>and</strong> imports of automotive products, by type of good, 1995-2016<br />
(Billions of dollars)<br />
A. Exports B. Imports<br />
100<br />
45<br />
90<br />
40<br />
80<br />
70<br />
60<br />
50<br />
40<br />
30<br />
20<br />
10<br />
35<br />
30<br />
25<br />
20<br />
15<br />
10<br />
5<br />
0<br />
1995 2000 2005 2010 2016<br />
0<br />
1995 2000 2005 2010 2016<br />
Electrical equipment<br />
for automotive products<br />
Eng<strong>in</strong>es<br />
Parts,<br />
accessories,<br />
components<br />
Buses<br />
Trucks<br />
Passenger automobiles<br />
<strong>and</strong> light commercial vehicles<br />
Source: Economic Commission for Lat<strong>in</strong> <strong>America</strong> <strong>and</strong> <strong>the</strong> <strong>Caribbean</strong> (ECLAC), on <strong>the</strong> basis of United Nations Commodity Trade Statistics Database (COMTRADE).<br />
Note: Automotive products per groups 778.3, 713.2, 784, 783, 782 <strong>and</strong> 781 of <strong>the</strong> St<strong>and</strong>ard International Trade Classification (SITC), Rev. 3.<br />
Autoparts firms do not only serve <strong>the</strong> needs of manufacturers operat<strong>in</strong>g <strong>in</strong> Mexico.<br />
Between 2009 <strong>and</strong> 2016, exports of autoparts <strong>in</strong>creased significantly from US$ 9.298 billion<br />
to US$ 26.273 billion (see figure III.15). Despite <strong>the</strong> large number of free trade agreements<br />
that Mexico has entered <strong>in</strong>to, it lacks diversity <strong>in</strong> <strong>the</strong> markets where it sells its autoparts, with<br />
more than 90% of production exported to <strong>the</strong> United States <strong>and</strong> Canada (see figure III.16).<br />
In 2015, Mexico was <strong>the</strong> fifth largest exporter of autoparts <strong>in</strong> <strong>the</strong> world, beh<strong>in</strong>d Germany,<br />
<strong>the</strong> United States, Japan <strong>and</strong> Ch<strong>in</strong>a. In 2016, 60% of autoparts imported by Mexico came<br />
from <strong>the</strong> United States, followed by Japan (10%), Ch<strong>in</strong>a (7.3%), <strong>the</strong> Republic of Korea (5%)<br />
<strong>and</strong> Germany (4.3%).<br />
Figure III.16<br />
Mexico: exports <strong>and</strong> imports of automotive products, by geographical orig<strong>in</strong> <strong>and</strong> dest<strong>in</strong>ation, 1995-2016<br />
(Billions of dollars)<br />
A. Exports B. Imports<br />
100<br />
90<br />
80<br />
70<br />
60<br />
50<br />
40<br />
30<br />
20<br />
10<br />
0<br />
1995 2000 2005 2010 2016<br />
45<br />
40<br />
35<br />
30<br />
25<br />
20<br />
15<br />
10<br />
5<br />
0<br />
1995 2000 2005 2010 2016<br />
O<strong>the</strong>rs<br />
Rep. of Korea<br />
Japan<br />
Ch<strong>in</strong>a<br />
Brazil<br />
Germany<br />
Canada<br />
United States<br />
Source: Economic Commission for Lat<strong>in</strong> <strong>America</strong> <strong>and</strong> <strong>the</strong> <strong>Caribbean</strong> (ECLAC), on <strong>the</strong> basis of United Nations Commodity Trade Statistics Database (COMTRADE).


