

Foreign Direct Investment in Latin America and the Caribbean 2017
This publication sets out and analyses the main foreign direct investment (FDI) trends in the countries of Latin America and the Caribbean. The 2017 edition shows that the region is at a difficult juncture. FDI inflows declined by 7.9% in 2016, to US$ 167.043 billion, representing a cumulative fall of 17.0% since the peak in 2011. The fall in commodity prices continues to affect investments in natural resources, sluggish economic growth in several countries has slowed the flow of market-seeking capital, and the global backdrop of technological sophistication and expansion of the digital economy has concentrated transnational investments in developed economies.
This publication sets out and analyses the main foreign direct investment (FDI) trends in the countries of Latin America and the Caribbean. The 2017 edition shows that the region is at a difficult juncture. FDI inflows declined by 7.9% in 2016, to US$ 167.043 billion, representing a cumulative fall of 17.0% since the peak in 2011. The fall in commodity prices continues to affect investments in natural resources, sluggish economic growth in several countries has slowed the flow of market-seeking capital, and the global backdrop of technological sophistication and expansion of the digital economy has concentrated transnational investments in developed economies.

Create successful ePaper yourself
Turn your PDF publications into a flip-book with our unique Google optimized e-Paper software.
<strong>Foreign</strong> <strong>Direct</strong> <strong>Investment</strong> <strong>in</strong> Lat<strong>in</strong> <strong>America</strong> <strong>and</strong> <strong>the</strong> <strong>Caribbean</strong> • <strong>2017</strong><br />
Chapter III<br />
165<br />
A. Exports<br />
100<br />
90<br />
80<br />
70<br />
60<br />
50<br />
40<br />
30<br />
20<br />
10<br />
0<br />
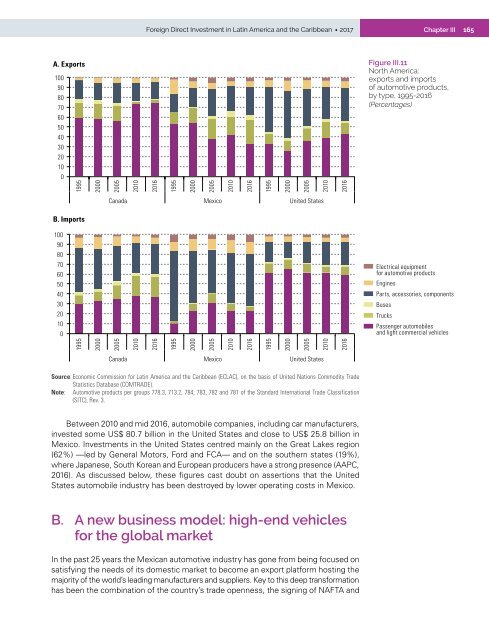
Figure III.11<br />
North <strong>America</strong>:<br />
exports <strong>and</strong> imports<br />
of automotive products,<br />
by type, 1995-2016<br />
(Percentages)<br />
1995<br />
2000<br />
2005<br />
2010<br />
2016<br />
1995<br />
2000<br />
2005<br />
2010<br />
2016<br />
1995<br />
2000<br />
2005<br />
2010<br />
2016<br />
Canada Mexico United States<br />
B. Imports<br />
100<br />
90<br />
80<br />
70<br />
60<br />
50<br />
40<br />
30<br />
20<br />
10<br />
0<br />
Electrical equipment<br />
for automotive products<br />
Eng<strong>in</strong>es<br />
Parts, accessories, components<br />
Buses<br />
Trucks<br />
Passenger automobiles<br />
<strong>and</strong> light commercial vehicles<br />
1995<br />
2000<br />
2005<br />
2010<br />
2016<br />
1995<br />
2000<br />
2005<br />
2010<br />
2016<br />
1995<br />
2000<br />
2005<br />
2010<br />
2016<br />
Canada Mexico United States<br />
Source: Economic Commission for Lat<strong>in</strong> <strong>America</strong> <strong>and</strong> <strong>the</strong> <strong>Caribbean</strong> (ECLAC), on <strong>the</strong> basis of United Nations Commodity Trade<br />
Statistics Database (COMTRADE).<br />
Note: Automotive products per groups 778.3, 713.2, 784, 783, 782 <strong>and</strong> 781 of <strong>the</strong> St<strong>and</strong>ard International Trade Classification<br />
(SITC), Rev. 3.<br />
Between 2010 <strong>and</strong> mid 2016, automobile companies, <strong>in</strong>clud<strong>in</strong>g car manufacturers,<br />
<strong>in</strong>vested some US$ 80.7 billion <strong>in</strong> <strong>the</strong> United States <strong>and</strong> close to US$ 25.8 billion <strong>in</strong><br />
Mexico. <strong>Investment</strong>s <strong>in</strong> <strong>the</strong> United States centred ma<strong>in</strong>ly on <strong>the</strong> Great Lakes region<br />
(62%) —led by General Motors, Ford <strong>and</strong> FCA— <strong>and</strong> on <strong>the</strong> sou<strong>the</strong>rn states (19%),<br />
where Japanese, South Korean <strong>and</strong> European producers have a strong presence (AAPC,<br />
2016). As discussed below, <strong>the</strong>se figures cast doubt on assertions that <strong>the</strong> United<br />
States automobile <strong>in</strong>dustry has been destroyed by lower operat<strong>in</strong>g costs <strong>in</strong> Mexico.<br />
B. A new bus<strong>in</strong>ess model: high-end vehicles<br />
for <strong>the</strong> global market<br />
In <strong>the</strong> past 25 years <strong>the</strong> Mexican automotive <strong>in</strong>dustry has gone from be<strong>in</strong>g focused on<br />
satisfy<strong>in</strong>g <strong>the</strong> needs of its domestic market to become an export platform host<strong>in</strong>g <strong>the</strong><br />
majority of <strong>the</strong> world’s lead<strong>in</strong>g manufacturers <strong>and</strong> suppliers. Key to this deep transformation<br />
has been <strong>the</strong> comb<strong>in</strong>ation of <strong>the</strong> country’s trade openness, <strong>the</strong> sign<strong>in</strong>g of NAFTA <strong>and</strong>


