

Foreign Direct Investment in Latin America and the Caribbean 2017
This publication sets out and analyses the main foreign direct investment (FDI) trends in the countries of Latin America and the Caribbean. The 2017 edition shows that the region is at a difficult juncture. FDI inflows declined by 7.9% in 2016, to US$ 167.043 billion, representing a cumulative fall of 17.0% since the peak in 2011. The fall in commodity prices continues to affect investments in natural resources, sluggish economic growth in several countries has slowed the flow of market-seeking capital, and the global backdrop of technological sophistication and expansion of the digital economy has concentrated transnational investments in developed economies.
This publication sets out and analyses the main foreign direct investment (FDI) trends in the countries of Latin America and the Caribbean. The 2017 edition shows that the region is at a difficult juncture. FDI inflows declined by 7.9% in 2016, to US$ 167.043 billion, representing a cumulative fall of 17.0% since the peak in 2011. The fall in commodity prices continues to affect investments in natural resources, sluggish economic growth in several countries has slowed the flow of market-seeking capital, and the global backdrop of technological sophistication and expansion of the digital economy has concentrated transnational investments in developed economies.

Create successful ePaper yourself
Turn your PDF publications into a flip-book with our unique Google optimized e-Paper software.
<strong>Foreign</strong> <strong>Direct</strong> <strong>Investment</strong> <strong>in</strong> Lat<strong>in</strong> <strong>America</strong> <strong>and</strong> <strong>the</strong> <strong>Caribbean</strong> • <strong>2017</strong><br />
Chapter III<br />
167<br />
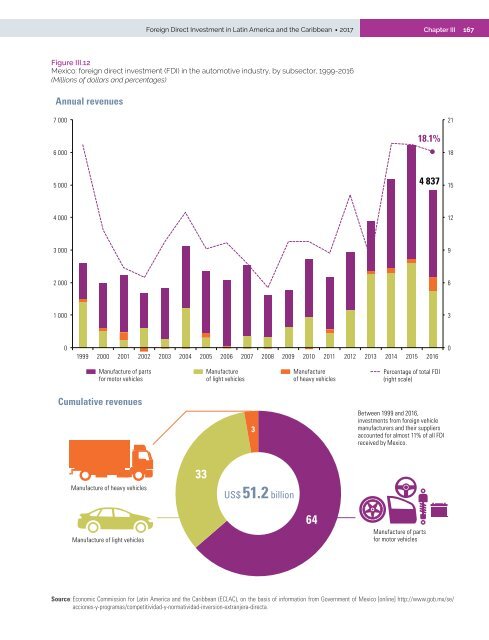
Figure III.12<br />
Mexico: foreign direct <strong>in</strong>vestment (FDI) <strong>in</strong> <strong>the</strong> automotive <strong>in</strong>dustry, by subsector, 1999-2016<br />
(Millions of dollars <strong>and</strong> percentages)<br />
Annual revenues<br />
7 000<br />
21<br />
6 000<br />
18.1%<br />
18<br />
5 000<br />
4 837<br />
15<br />
4 000<br />
12<br />
3 000<br />
9<br />
2 000<br />
6<br />
1 000<br />
3<br />
0<br />
1999 2000 2001 2002 2003 2004 2005 2006 2007 2008 2009 2010 2011 2012 2013 2014 2015 2016<br />
0<br />
Manufacture of parts<br />
for motor vehicles<br />
Manufacture<br />
of light vehicles<br />
Manufacture<br />
of heavy vehicles<br />
Percentage of total FDI<br />
(right scale)<br />
Cumulative revenues<br />
3<br />
Between 1999 <strong>and</strong> 2016,<br />
<strong>in</strong>vestments from foreign vehicle<br />
manufacturers <strong>and</strong> <strong>the</strong>ir suppliers<br />
accounted for almost 11% of all FDI<br />
received by Mexico.<br />
Manufacture of heavy vehicles<br />
33<br />
US$ 51.2 billion<br />
Manufacture of light vehicles<br />
64<br />
Manufacture of parts<br />
for motor vehicles<br />
Source: Economic Commission for Lat<strong>in</strong> <strong>America</strong> <strong>and</strong> <strong>the</strong> <strong>Caribbean</strong> (ECLAC), on <strong>the</strong> basis of <strong>in</strong>formation from Government of Mexico [onl<strong>in</strong>e] http://www.gob.mx/se/<br />
acciones-y-programas/competitividad-y-normatividad-<strong>in</strong>version-extranjera-directa.


