

Foreign Direct Investment in Latin America and the Caribbean 2017
This publication sets out and analyses the main foreign direct investment (FDI) trends in the countries of Latin America and the Caribbean. The 2017 edition shows that the region is at a difficult juncture. FDI inflows declined by 7.9% in 2016, to US$ 167.043 billion, representing a cumulative fall of 17.0% since the peak in 2011. The fall in commodity prices continues to affect investments in natural resources, sluggish economic growth in several countries has slowed the flow of market-seeking capital, and the global backdrop of technological sophistication and expansion of the digital economy has concentrated transnational investments in developed economies.
This publication sets out and analyses the main foreign direct investment (FDI) trends in the countries of Latin America and the Caribbean. The 2017 edition shows that the region is at a difficult juncture. FDI inflows declined by 7.9% in 2016, to US$ 167.043 billion, representing a cumulative fall of 17.0% since the peak in 2011. The fall in commodity prices continues to affect investments in natural resources, sluggish economic growth in several countries has slowed the flow of market-seeking capital, and the global backdrop of technological sophistication and expansion of the digital economy has concentrated transnational investments in developed economies.

You also want an ePaper? Increase the reach of your titles
YUMPU automatically turns print PDFs into web optimized ePapers that Google loves.
182 Chapter III Economic Commission for Lat<strong>in</strong> <strong>America</strong> <strong>and</strong> <strong>the</strong> <strong>Caribbean</strong> (ECLAC)<br />
Box III.1<br />
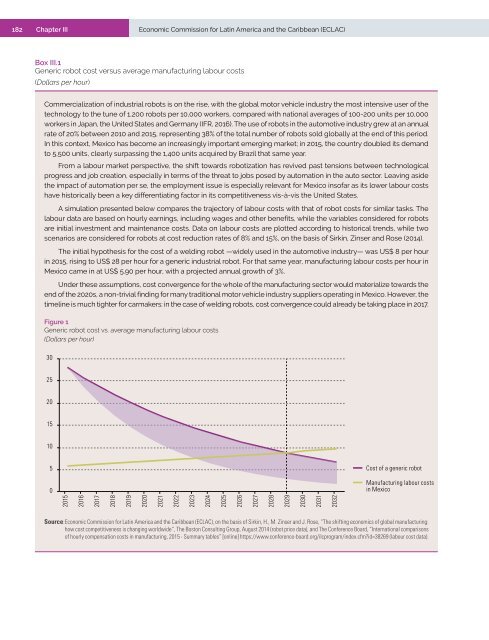
Generic robot cost versus average manufactur<strong>in</strong>g labour costs<br />
(Dollars per hour)<br />
Commercialization of <strong>in</strong>dustrial robots is on <strong>the</strong> rise, with <strong>the</strong> global motor vehicle <strong>in</strong>dustry <strong>the</strong> most <strong>in</strong>tensive user of <strong>the</strong><br />
technology to <strong>the</strong> tune of 1,200 robots per 10,000 workers, compared with national averages of 100-200 units per 10,000<br />
workers <strong>in</strong> Japan, <strong>the</strong> United States <strong>and</strong> Germany (IFR, 2016). The use of robots <strong>in</strong> <strong>the</strong> automotive <strong>in</strong>dustry grew at an annual<br />
rate of 20% between 2010 <strong>and</strong> 2015, represent<strong>in</strong>g 38% of <strong>the</strong> total number of robots sold globally at <strong>the</strong> end of this period.<br />
In this context, Mexico has become an <strong>in</strong>creas<strong>in</strong>gly important emerg<strong>in</strong>g market; <strong>in</strong> 2015, <strong>the</strong> country doubled its dem<strong>and</strong><br />
to 5,500 units, clearly surpass<strong>in</strong>g <strong>the</strong> 1,400 units acquired by Brazil that same year.<br />
From a labour market perspective, <strong>the</strong> shift towards robotization has revived past tensions between technological<br />
progress <strong>and</strong> job creation, especially <strong>in</strong> terms of <strong>the</strong> threat to jobs posed by automation <strong>in</strong> <strong>the</strong> auto sector. Leav<strong>in</strong>g aside<br />
<strong>the</strong> impact of automation per se, <strong>the</strong> employment issue is especially relevant for Mexico <strong>in</strong>sofar as its lower labour costs<br />
have historically been a key differentiat<strong>in</strong>g factor <strong>in</strong> its competitiveness vis-à-vis <strong>the</strong> United States.<br />
A simulation presented below compares <strong>the</strong> trajectory of labour costs with that of robot costs for similar tasks. The<br />
labour data are based on hourly earn<strong>in</strong>gs, <strong>in</strong>clud<strong>in</strong>g wages <strong>and</strong> o<strong>the</strong>r benefits, while <strong>the</strong> variables considered for robots<br />
are <strong>in</strong>itial <strong>in</strong>vestment <strong>and</strong> ma<strong>in</strong>tenance costs. Data on labour costs are plotted accord<strong>in</strong>g to historical trends, while two<br />
scenarios are considered for robots at cost reduction rates of 8% <strong>and</strong> 15%, on <strong>the</strong> basis of Sirk<strong>in</strong>, Z<strong>in</strong>ser <strong>and</strong> Rose (2014).<br />
The <strong>in</strong>itial hypo<strong>the</strong>sis for <strong>the</strong> cost of a weld<strong>in</strong>g robot —widely used <strong>in</strong> <strong>the</strong> automotive <strong>in</strong>dustry— was US$ 8 per hour<br />
<strong>in</strong> 2015, ris<strong>in</strong>g to US$ 28 per hour for a generic <strong>in</strong>dustrial robot. For that same year, manufactur<strong>in</strong>g labour costs per hour <strong>in</strong><br />
Mexico came <strong>in</strong> at US$ 5.90 per hour, with a projected annual growth of 3%.<br />
Under <strong>the</strong>se assumptions, cost convergence for <strong>the</strong> whole of <strong>the</strong> manufactur<strong>in</strong>g sector would materialize towards <strong>the</strong><br />
end of <strong>the</strong> 2020s, a non-trivial f<strong>in</strong>d<strong>in</strong>g for many traditional motor vehicle <strong>in</strong>dustry suppliers operat<strong>in</strong>g <strong>in</strong> Mexico. However, <strong>the</strong><br />
timel<strong>in</strong>e is much tighter for carmakers: <strong>in</strong> <strong>the</strong> case of weld<strong>in</strong>g robots, cost convergence could already be tak<strong>in</strong>g place <strong>in</strong> <strong>2017</strong>.<br />
Figure 1<br />
Generic robot cost vs. average manufactur<strong>in</strong>g labour costs<br />
(Dollars per hour)<br />
30<br />
25<br />
20<br />
15<br />
10<br />
5<br />
Cost of a generic robot<br />
0<br />
Manufactur<strong>in</strong>g labour costs<br />
<strong>in</strong> Mexico<br />
2015<br />
2016<br />
<strong>2017</strong><br />
2018<br />
2019<br />
2020<br />
2021<br />
2022<br />
2023<br />
2024<br />
2025<br />
2026<br />
2027<br />
2028<br />
2029<br />
2030<br />
2031<br />
2032<br />
Source: Economic Commission for Lat<strong>in</strong> <strong>America</strong> <strong>and</strong> <strong>the</strong> <strong>Caribbean</strong> (ECLAC), on <strong>the</strong> basis of Sirk<strong>in</strong>, H., M. Z<strong>in</strong>ser <strong>and</strong> J. Rose, “The shift<strong>in</strong>g economics of global manufactur<strong>in</strong>g:<br />
how cost competitiveness is chang<strong>in</strong>g worldwide”, The Boston Consult<strong>in</strong>g Group, August 2014 (robot price data), <strong>and</strong> The Conference Board, “International comparisons<br />
of hourly compensation costs <strong>in</strong> manufactur<strong>in</strong>g, 2015 - Summary tables” [onl<strong>in</strong>e] https://www.conference-board.org/ilcprogram/<strong>in</strong>dex.cfm?id=38269 (labour cost data).


