

Foreign Direct Investment in Latin America and the Caribbean 2017
This publication sets out and analyses the main foreign direct investment (FDI) trends in the countries of Latin America and the Caribbean. The 2017 edition shows that the region is at a difficult juncture. FDI inflows declined by 7.9% in 2016, to US$ 167.043 billion, representing a cumulative fall of 17.0% since the peak in 2011. The fall in commodity prices continues to affect investments in natural resources, sluggish economic growth in several countries has slowed the flow of market-seeking capital, and the global backdrop of technological sophistication and expansion of the digital economy has concentrated transnational investments in developed economies.
This publication sets out and analyses the main foreign direct investment (FDI) trends in the countries of Latin America and the Caribbean. The 2017 edition shows that the region is at a difficult juncture. FDI inflows declined by 7.9% in 2016, to US$ 167.043 billion, representing a cumulative fall of 17.0% since the peak in 2011. The fall in commodity prices continues to affect investments in natural resources, sluggish economic growth in several countries has slowed the flow of market-seeking capital, and the global backdrop of technological sophistication and expansion of the digital economy has concentrated transnational investments in developed economies.

You also want an ePaper? Increase the reach of your titles
YUMPU automatically turns print PDFs into web optimized ePapers that Google loves.
<strong>Foreign</strong> <strong>Direct</strong> <strong>Investment</strong> <strong>in</strong> Lat<strong>in</strong> <strong>America</strong> <strong>and</strong> <strong>the</strong> <strong>Caribbean</strong> • <strong>2017</strong><br />
Chapter III<br />
161<br />
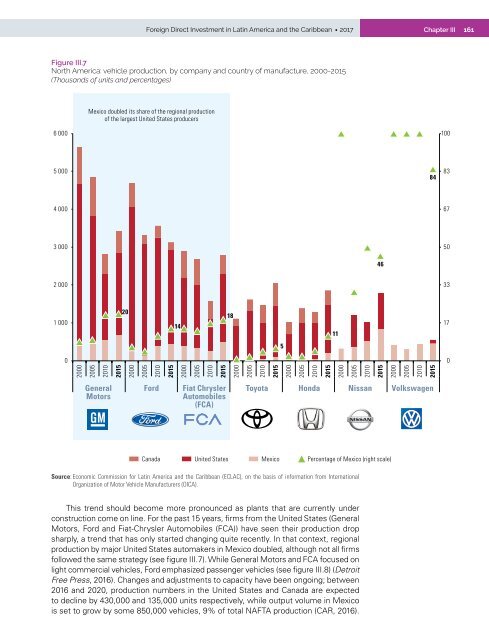
Figure III.7<br />
North <strong>America</strong>: vehicle production, by company <strong>and</strong> country of manufacture, 2000-2015<br />
(Thous<strong>and</strong>s of units <strong>and</strong> percentages)<br />
6 000<br />
Mexico doubled its share of <strong>the</strong> regional production<br />
of <strong>the</strong> largest United States producers<br />
100<br />
5 000<br />
84<br />
83<br />
4 000<br />
67<br />
3 000<br />
50<br />
46<br />
2 000<br />
33<br />
1 000<br />
20<br />
14<br />
18<br />
11<br />
17<br />
5<br />
0<br />
0<br />
2000<br />
2005<br />
2010<br />
2015<br />
2000<br />
2005<br />
2010<br />
2015<br />
2000<br />
2005<br />
2010<br />
2015<br />
2000<br />
2005<br />
2010<br />
2015<br />
2000<br />
2005<br />
2010<br />
2015<br />
2000<br />
2005<br />
2010<br />
2015<br />
2000<br />
2005<br />
2010<br />
2015<br />
General<br />
Motors<br />
Ford<br />
Fiat Chrysler<br />
Automobiles<br />
(FCA)<br />
Toyota Honda Nissan Volkswagen<br />
Canada<br />
United States<br />
Mexico<br />
Percentage of Mexico (right scale)<br />
Source: Economic Commission for Lat<strong>in</strong> <strong>America</strong> <strong>and</strong> <strong>the</strong> <strong>Caribbean</strong> (ECLAC), on <strong>the</strong> basis of <strong>in</strong>formation from International<br />
Organization of Motor Vehicle Manufacturers (OICA).<br />
This trend should become more pronounced as plants that are currently under<br />
construction come on l<strong>in</strong>e. For <strong>the</strong> past 15 years, firms from <strong>the</strong> United States (General<br />
Motors, Ford <strong>and</strong> Fiat-Chrysler Automobiles (FCA)) have seen <strong>the</strong>ir production drop<br />
sharply, a trend that has only started chang<strong>in</strong>g quite recently. In that context, regional<br />
production by major United States automakers <strong>in</strong> Mexico doubled, although not all firms<br />
followed <strong>the</strong> same strategy (see figure III.7). While General Motors <strong>and</strong> FCA focused on<br />
light commercial vehicles, Ford emphasized passenger vehicles (see figure III.8) (Detroit<br />
Free Press, 2016). Changes <strong>and</strong> adjustments to capacity have been ongo<strong>in</strong>g; between<br />
2016 <strong>and</strong> 2020, production numbers <strong>in</strong> <strong>the</strong> United States <strong>and</strong> Canada are expected<br />
to decl<strong>in</strong>e by 430,000 <strong>and</strong> 135,000 units respectively, while output volume <strong>in</strong> Mexico<br />
is set to grow by some 850,000 vehicles, 9% of total NAFTA production (CAR, 2016).


