

Foreign Direct Investment in Latin America and the Caribbean 2017
This publication sets out and analyses the main foreign direct investment (FDI) trends in the countries of Latin America and the Caribbean. The 2017 edition shows that the region is at a difficult juncture. FDI inflows declined by 7.9% in 2016, to US$ 167.043 billion, representing a cumulative fall of 17.0% since the peak in 2011. The fall in commodity prices continues to affect investments in natural resources, sluggish economic growth in several countries has slowed the flow of market-seeking capital, and the global backdrop of technological sophistication and expansion of the digital economy has concentrated transnational investments in developed economies.
This publication sets out and analyses the main foreign direct investment (FDI) trends in the countries of Latin America and the Caribbean. The 2017 edition shows that the region is at a difficult juncture. FDI inflows declined by 7.9% in 2016, to US$ 167.043 billion, representing a cumulative fall of 17.0% since the peak in 2011. The fall in commodity prices continues to affect investments in natural resources, sluggish economic growth in several countries has slowed the flow of market-seeking capital, and the global backdrop of technological sophistication and expansion of the digital economy has concentrated transnational investments in developed economies.

You also want an ePaper? Increase the reach of your titles
YUMPU automatically turns print PDFs into web optimized ePapers that Google loves.
44 Chapter I Economic Commission for Lat<strong>in</strong> <strong>America</strong> <strong>and</strong> <strong>the</strong> <strong>Caribbean</strong> (ECLAC)<br />
Figure I.14<br />
Lat<strong>in</strong> <strong>America</strong> <strong>and</strong> <strong>the</strong> <strong>Caribbean</strong>: cross-border capital <strong>in</strong>flows, 2005-2016<br />
(Billions of dollars)<br />
450<br />
400<br />
350<br />
300<br />
250<br />
200<br />
150<br />
100<br />
50<br />
0<br />
O<strong>the</strong>r <strong>in</strong>vestment<br />
<strong>in</strong>flows<br />
Portfolio <strong>in</strong>vestment<br />
<strong>in</strong>flows<br />
<strong>Foreign</strong> direct <strong>in</strong>vestment<br />
<strong>in</strong>flows<br />
-50<br />
2005 2006 2007 2008 2009 2010 2011 2012 2013 2014 2015 2016<br />
Source: Economic Commission for Lat<strong>in</strong> <strong>America</strong> <strong>and</strong> <strong>the</strong> <strong>Caribbean</strong> (ECLAC), on <strong>the</strong> basis of official figures <strong>and</strong> estimates as of 15 June <strong>2017</strong>.<br />
Note: FDI data prior to 2010 are not directly comparable with those for 2010 <strong>and</strong> later. This is represented by a white l<strong>in</strong>e on <strong>the</strong> graph.<br />
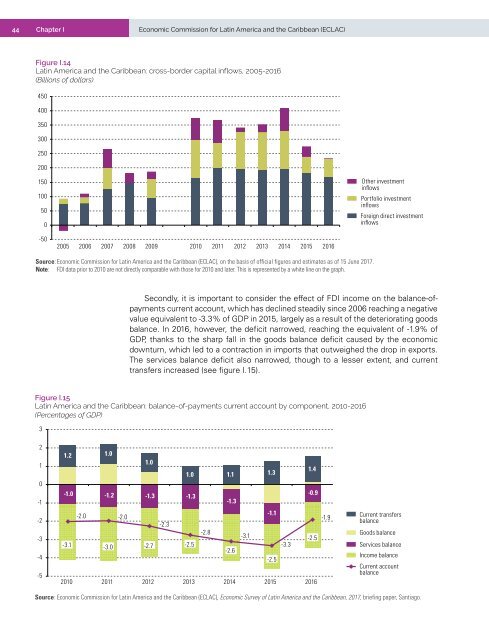
Secondly, it is important to consider <strong>the</strong> effect of FDI <strong>in</strong>come on <strong>the</strong> balance-ofpayments<br />
current account, which has decl<strong>in</strong>ed steadily s<strong>in</strong>ce 2006 reach<strong>in</strong>g a negative<br />
value equivalent to -3.3% of GDP <strong>in</strong> 2015, largely as a result of <strong>the</strong> deteriorat<strong>in</strong>g goods<br />
balance. In 2016, however, <strong>the</strong> deficit narrowed, reach<strong>in</strong>g <strong>the</strong> equivalent of -1.9% of<br />
GDP, thanks to <strong>the</strong> sharp fall <strong>in</strong> <strong>the</strong> goods balance deficit caused by <strong>the</strong> economic<br />
downturn, which led to a contraction <strong>in</strong> imports that outweighed <strong>the</strong> drop <strong>in</strong> exports.<br />
The services balance deficit also narrowed, though to a lesser extent, <strong>and</strong> current<br />
transfers <strong>in</strong>creased (see figure I.15).<br />
Figure I.15<br />
Lat<strong>in</strong> <strong>America</strong> <strong>and</strong> <strong>the</strong> <strong>Caribbean</strong>: balance-of-payments current account by component, 2010-2016<br />
(Percentages of GDP)<br />
3<br />
2<br />
1<br />
0<br />
-1<br />
-2<br />
-3<br />
-4<br />
-5<br />
1.2 1.0<br />
1.0<br />
1.4<br />
1.0 1.1 1.3<br />
-1.0 -1.2 -1.3<br />
-0.9<br />
-1.3<br />
-1.3<br />
-2.0 -2.0<br />
-1.1<br />
-2.3<br />
-3.1<br />
-2.8<br />
- -3.1 -2.5<br />
-3.0 -2.7 -2.5<br />
-3.3<br />
-2.6<br />
-2.5<br />
2010 2011 2012 2013 2014 2015 2016<br />
-1.9<br />
Current transfers<br />
balance<br />
Goods balance<br />
Services balance<br />
Income balance<br />
Current account<br />
balance<br />
Source: Economic Commission for Lat<strong>in</strong> <strong>America</strong> <strong>and</strong> <strong>the</strong> <strong>Caribbean</strong> (ECLAC), Economic Survey of Lat<strong>in</strong> <strong>America</strong> <strong>and</strong> <strong>the</strong> <strong>Caribbean</strong>, <strong>2017</strong>, brief<strong>in</strong>g paper, Santiago.


