

Foreign Direct Investment in Latin America and the Caribbean 2017
This publication sets out and analyses the main foreign direct investment (FDI) trends in the countries of Latin America and the Caribbean. The 2017 edition shows that the region is at a difficult juncture. FDI inflows declined by 7.9% in 2016, to US$ 167.043 billion, representing a cumulative fall of 17.0% since the peak in 2011. The fall in commodity prices continues to affect investments in natural resources, sluggish economic growth in several countries has slowed the flow of market-seeking capital, and the global backdrop of technological sophistication and expansion of the digital economy has concentrated transnational investments in developed economies.
This publication sets out and analyses the main foreign direct investment (FDI) trends in the countries of Latin America and the Caribbean. The 2017 edition shows that the region is at a difficult juncture. FDI inflows declined by 7.9% in 2016, to US$ 167.043 billion, representing a cumulative fall of 17.0% since the peak in 2011. The fall in commodity prices continues to affect investments in natural resources, sluggish economic growth in several countries has slowed the flow of market-seeking capital, and the global backdrop of technological sophistication and expansion of the digital economy has concentrated transnational investments in developed economies.

Create successful ePaper yourself
Turn your PDF publications into a flip-book with our unique Google optimized e-Paper software.
78 Chapter I Economic Commission for Lat<strong>in</strong> <strong>America</strong> <strong>and</strong> <strong>the</strong> <strong>Caribbean</strong> (ECLAC)<br />
Annex I.A1<br />
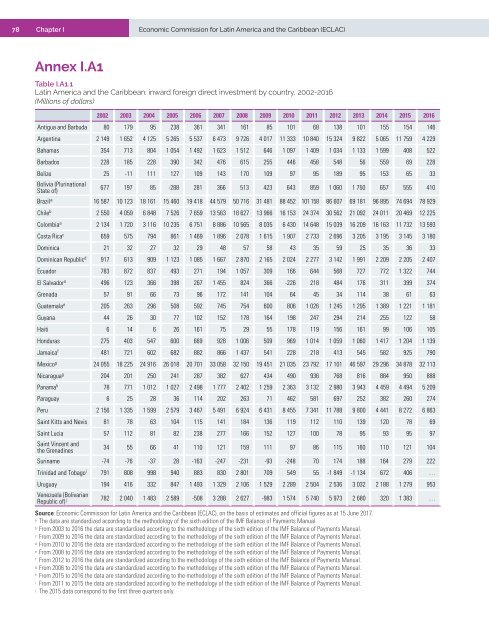
Table I.A1.1<br />
Lat<strong>in</strong> <strong>America</strong> <strong>and</strong> <strong>the</strong> <strong>Caribbean</strong>: <strong>in</strong>ward foreign direct <strong>in</strong>vestment by country, 2002-2016<br />
(Millions of dollars)<br />
2002 2003 2004 2005 2006 2007 2008 2009 2010 2011 2012 2013 2014 2015 2016<br />
Antigua <strong>and</strong> Barbuda 80 179 95 238 361 341 161 85 101 68 138 101 155 154 146<br />
Argent<strong>in</strong>a 2 149 1 652 4 125 5 265 5 537 6 473 9 726 4 017 11 333 10 840 15 324 9 822 5 065 11 759 4 229<br />
Bahamas 354 713 804 1 054 1 492 1 623 1 512 646 1 097 1 409 1 034 1 133 1 599 408 522<br />
Barbados 228 185 228 390 342 476 615 255 446 458 548 56 559 69 228<br />
Belize 25 -11 111 127 109 143 170 109 97 95 189 95 153 65 33<br />
Bolivia (Plur<strong>in</strong>ational<br />
State of)<br />
677 197 85 -288 281 366 513 423 643 859 1 060 1 750 657 555 410<br />
Brazil a 16 587 10 123 18 161 15 460 19 418 44 579 50 716 31 481 88 452 101 158 86 607 69 181 96 895 74 694 78 929<br />
Chile b 2 550 4 059 6 848 7 526 7 659 13 563 18 627 13 966 16 153 24 374 30 562 21 092 24 011 20 469 12 225<br />
Colombia a 2 134 1 720 3 116 10 235 6 751 8 886 10 565 8 035 6 430 14 648 15 039 16 209 16 163 11 732 13 593<br />
Costa Rica c 659 575 794 861 1 469 1 896 2 078 1 615 1 907 2 733 2 696 3 205 3 195 3 145 3 180<br />
Dom<strong>in</strong>ica 21 32 27 32 29 48 57 58 43 35 59 25 35 36 33<br />
Dom<strong>in</strong>ican Republic d 917 613 909 1 123 1 085 1 667 2 870 2 165 2 024 2 277 3 142 1 991 2 209 2 205 2 407<br />
Ecuador 783 872 837 493 271 194 1 057 309 166 644 568 727 772 1 322 744<br />
El Salvador a 496 123 366 398 267 1 455 824 366 -226 218 484 176 311 399 374<br />
Grenada 57 91 66 73 96 172 141 104 64 45 34 114 38 61 63<br />
Guatemala e 205 263 296 508 592 745 754 600 806 1 026 1 245 1 295 1 389 1 221 1 181<br />
Guyana 44 26 30 77 102 152 178 164 198 247 294 214 255 122 58<br />
Haiti 6 14 6 26 161 75 29 55 178 119 156 161 99 106 105<br />
Honduras 275 403 547 600 669 928 1 006 509 969 1 014 1 059 1 060 1 417 1 204 1 139<br />
Jamaica f 481 721 602 682 882 866 1 437 541 228 218 413 545 582 925 790<br />
Mexico g 24 055 18 225 24 916 26 018 20 701 33 058 32 150 19 451 21 035 23 792 17 101 46 597 29 296 34 878 32 113<br />
Nicaragua g 204 201 250 241 287 382 627 434 490 936 768 816 884 950 888<br />
Panama h 78 771 1 012 1 027 2 498 1 777 2 402 1 259 2 363 3 132 2 980 3 943 4 459 4 494 5 209<br />
Paraguay 6 25 28 36 114 202 263 71 462 581 697 252 382 260 274<br />
Peru 2 156 1 335 1 599 2 579 3 467 5 491 6 924 6 431 8 455 7 341 11 788 9 800 4 441 8 272 6 863<br />
Sa<strong>in</strong>t Kitts <strong>and</strong> Nevis 81 78 63 104 115 141 184 136 119 112 110 139 120 78 69<br />
Sa<strong>in</strong>t Lucia 57 112 81 82 238 277 166 152 127 100 78 95 93 95 97<br />
Sa<strong>in</strong>t V<strong>in</strong>cent <strong>and</strong><br />
<strong>the</strong> Grenad<strong>in</strong>es<br />
34 55 66 41 110 121 159 111 97 86 115 160 110 121 104<br />
Sur<strong>in</strong>ame -74 -76 -37 28 -163 -247 -231 -93 -248 70 174 188 164 279 222<br />
Tr<strong>in</strong>idad <strong>and</strong> Tobago i 791 808 998 940 883 830 2 801 709 549 55 -1 849 -1 134 672 406 …<br />
Uruguay 194 416 332 847 1 493 1 329 2 106 1 529 2 289 2 504 2 536 3 032 2 188 1 279 953<br />
Venezuela (Bolivarian<br />
Republic of) j 782 2 040 1 483 2 589 -508 3 288 2 627 -983 1 574 5 740 5 973 2 680 320 1 383 …<br />
Source: Economic Commission for Lat<strong>in</strong> <strong>America</strong> <strong>and</strong> <strong>the</strong> <strong>Caribbean</strong> (ECLAC), on <strong>the</strong> basis of estimates <strong>and</strong> official figures as at 15 June <strong>2017</strong>.<br />
a<br />
The data are st<strong>and</strong>ardized accord<strong>in</strong>g to <strong>the</strong> methodology of <strong>the</strong> sixth edition of <strong>the</strong> IMF Balance of Payments Manual.<br />
b<br />
From 2003 to 2016 <strong>the</strong> data are st<strong>and</strong>ardized accord<strong>in</strong>g to <strong>the</strong> methodology of <strong>the</strong> sixth edition of <strong>the</strong> IMF Balance of Payments Manual.<br />
c<br />
From 2009 to 2016 <strong>the</strong> data are st<strong>and</strong>ardized accord<strong>in</strong>g to <strong>the</strong> methodology of <strong>the</strong> sixth edition of <strong>the</strong> IMF Balance of Payments Manual.<br />
d<br />
From 2010 to 2016 <strong>the</strong> data are st<strong>and</strong>ardized accord<strong>in</strong>g to <strong>the</strong> methodology of <strong>the</strong> sixth edition of <strong>the</strong> IMF Balance of Payments Manual.<br />
e<br />
From 2008 to 2016 <strong>the</strong> data are st<strong>and</strong>ardized accord<strong>in</strong>g to <strong>the</strong> methodology of <strong>the</strong> sixth edition of <strong>the</strong> IMF Balance of Payments Manual.<br />
f<br />
From 2012 to 2016 <strong>the</strong> data are st<strong>and</strong>ardized accord<strong>in</strong>g to <strong>the</strong> methodology of <strong>the</strong> sixth edition of <strong>the</strong> IMF Balance of Payments Manual.<br />
g<br />
From 2006 to 2016 <strong>the</strong> data are st<strong>and</strong>ardized accord<strong>in</strong>g to <strong>the</strong> methodology of <strong>the</strong> sixth edition of <strong>the</strong> IMF Balance of Payments Manual.<br />
h<br />
From 2015 to 2016 <strong>the</strong> data are st<strong>and</strong>ardized accord<strong>in</strong>g to <strong>the</strong> methodology of <strong>the</strong> sixth edition of <strong>the</strong> IMF Balance of Payments Manual.<br />
i<br />
From 2011 to 2015 <strong>the</strong> data are st<strong>and</strong>ardized accord<strong>in</strong>g to <strong>the</strong> methodology of <strong>the</strong> sixth edition of <strong>the</strong> IMF Balance of Payments Manual.<br />
j<br />
The 2015 data correspond to <strong>the</strong> first three quarters only.


