

Foreign Direct Investment in Latin America and the Caribbean 2017
This publication sets out and analyses the main foreign direct investment (FDI) trends in the countries of Latin America and the Caribbean. The 2017 edition shows that the region is at a difficult juncture. FDI inflows declined by 7.9% in 2016, to US$ 167.043 billion, representing a cumulative fall of 17.0% since the peak in 2011. The fall in commodity prices continues to affect investments in natural resources, sluggish economic growth in several countries has slowed the flow of market-seeking capital, and the global backdrop of technological sophistication and expansion of the digital economy has concentrated transnational investments in developed economies.
This publication sets out and analyses the main foreign direct investment (FDI) trends in the countries of Latin America and the Caribbean. The 2017 edition shows that the region is at a difficult juncture. FDI inflows declined by 7.9% in 2016, to US$ 167.043 billion, representing a cumulative fall of 17.0% since the peak in 2011. The fall in commodity prices continues to affect investments in natural resources, sluggish economic growth in several countries has slowed the flow of market-seeking capital, and the global backdrop of technological sophistication and expansion of the digital economy has concentrated transnational investments in developed economies.

Create successful ePaper yourself
Turn your PDF publications into a flip-book with our unique Google optimized e-Paper software.
<strong>Foreign</strong> <strong>Direct</strong> <strong>Investment</strong> <strong>in</strong> Lat<strong>in</strong> <strong>America</strong> <strong>and</strong> <strong>the</strong> <strong>Caribbean</strong> • <strong>2017</strong><br />
Chapter I<br />
29<br />
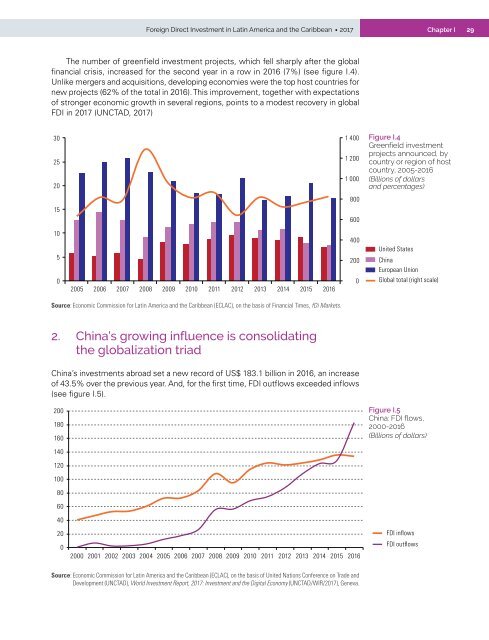
The number of greenfield <strong>in</strong>vestment projects, which fell sharply after <strong>the</strong> global<br />
f<strong>in</strong>ancial crisis, <strong>in</strong>creased for <strong>the</strong> second year <strong>in</strong> a row <strong>in</strong> 2016 (7%) (see figure I.4).<br />
Unlike mergers <strong>and</strong> acquisitions, develop<strong>in</strong>g economies were <strong>the</strong> top host countries for<br />
new projects (62% of <strong>the</strong> total <strong>in</strong> 2016). This improvement, toge<strong>the</strong>r with expectations<br />
of stronger economic growth <strong>in</strong> several regions, po<strong>in</strong>ts to a modest recovery <strong>in</strong> global<br />
FDI <strong>in</strong> <strong>2017</strong> (UNCTAD, <strong>2017</strong>)<br />
30<br />
25<br />
20<br />
1 400<br />
1 200<br />
1 000<br />
Figure I.4<br />
Greenfield <strong>in</strong>vestment<br />
projects announced, by<br />
country or region of host<br />
country, 2005-2016<br />
(Billions of dollars<br />
<strong>and</strong> percentages)<br />
800<br />
15<br />
600<br />
10<br />
5<br />
0<br />
2005 2006 2007 2008 2009 2010 2011 2012 2013 2014 2015 2016<br />
400<br />
200<br />
0<br />
United States<br />
Ch<strong>in</strong>a<br />
European Union<br />
Global total (right scale)<br />
Source: Economic Commission for Lat<strong>in</strong> <strong>America</strong> <strong>and</strong> <strong>the</strong> <strong>Caribbean</strong> (ECLAC), on <strong>the</strong> basis of F<strong>in</strong>ancial Times, fDi Markets.<br />
2. Ch<strong>in</strong>a’s grow<strong>in</strong>g <strong>in</strong>fluence is consolidat<strong>in</strong>g<br />
<strong>the</strong> globalization triad<br />
Ch<strong>in</strong>a’s <strong>in</strong>vestments abroad set a new record of US$ 183.1 billion <strong>in</strong> 2016, an <strong>in</strong>crease<br />
of 43.5% over <strong>the</strong> previous year. And, for <strong>the</strong> first time, FDI outflows exceeded <strong>in</strong>flows<br />
(see figure I.5).<br />
200<br />
180<br />
160<br />
Figure I.5<br />
Ch<strong>in</strong>a: FDI flows,<br />
2000-2016<br />
(Billions of dollars)<br />
140<br />
120<br />
100<br />
80<br />
60<br />
40<br />
20<br />
0<br />
2000 2001 2002 2003 2004 2005 2006 2007 2008 2009 2010 2011 2012 2013 2014 2015 2016<br />
FDI <strong>in</strong>flows<br />
FDI outflows<br />
Source: Economic Commission for Lat<strong>in</strong> <strong>America</strong> <strong>and</strong> <strong>the</strong> <strong>Caribbean</strong> (ECLAC), on <strong>the</strong> basis of United Nations Conference on Trade <strong>and</strong><br />
Development (UNCTAD), World <strong>Investment</strong> Report, <strong>2017</strong>: <strong>Investment</strong> <strong>and</strong> <strong>the</strong> Digital Economy (UNCTAD/WIR/<strong>2017</strong>), Geneva.


