

Foreign Direct Investment in Latin America and the Caribbean 2017
This publication sets out and analyses the main foreign direct investment (FDI) trends in the countries of Latin America and the Caribbean. The 2017 edition shows that the region is at a difficult juncture. FDI inflows declined by 7.9% in 2016, to US$ 167.043 billion, representing a cumulative fall of 17.0% since the peak in 2011. The fall in commodity prices continues to affect investments in natural resources, sluggish economic growth in several countries has slowed the flow of market-seeking capital, and the global backdrop of technological sophistication and expansion of the digital economy has concentrated transnational investments in developed economies.
This publication sets out and analyses the main foreign direct investment (FDI) trends in the countries of Latin America and the Caribbean. The 2017 edition shows that the region is at a difficult juncture. FDI inflows declined by 7.9% in 2016, to US$ 167.043 billion, representing a cumulative fall of 17.0% since the peak in 2011. The fall in commodity prices continues to affect investments in natural resources, sluggish economic growth in several countries has slowed the flow of market-seeking capital, and the global backdrop of technological sophistication and expansion of the digital economy has concentrated transnational investments in developed economies.

You also want an ePaper? Increase the reach of your titles
YUMPU automatically turns print PDFs into web optimized ePapers that Google loves.
98 Chapter II Economic Commission for Lat<strong>in</strong> <strong>America</strong> <strong>and</strong> <strong>the</strong> <strong>Caribbean</strong> (ECLAC)<br />
The geographical restructur<strong>in</strong>g of production did not only affect vehicle manufacturers,<br />
s<strong>in</strong>ce far-reach<strong>in</strong>g changes were generated among o<strong>the</strong>r agents <strong>in</strong> <strong>the</strong> production cha<strong>in</strong>.<br />
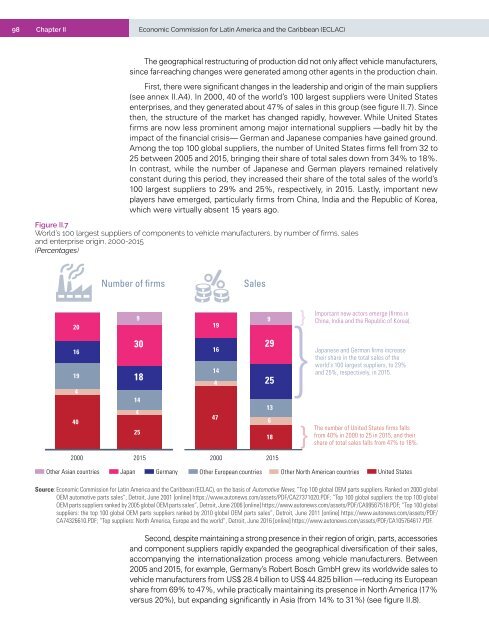
First, <strong>the</strong>re were significant changes <strong>in</strong> <strong>the</strong> leadership <strong>and</strong> orig<strong>in</strong> of <strong>the</strong> ma<strong>in</strong> suppliers<br />
(see annex II.A4). In 2000, 40 of <strong>the</strong> world’s 100 largest suppliers were United States<br />
enterprises, <strong>and</strong> <strong>the</strong>y generated about 47% of sales <strong>in</strong> this group (see figure II.7). S<strong>in</strong>ce<br />
<strong>the</strong>n, <strong>the</strong> structure of <strong>the</strong> market has changed rapidly, however. While United States<br />
firms are now less prom<strong>in</strong>ent among major <strong>in</strong>ternational suppliers —badly hit by <strong>the</strong><br />
impact of <strong>the</strong> f<strong>in</strong>ancial crisis— German <strong>and</strong> Japanese companies have ga<strong>in</strong>ed ground.<br />
Among <strong>the</strong> top 100 global suppliers, <strong>the</strong> number of United States firms fell from 32 to<br />
25 between 2005 <strong>and</strong> 2015, br<strong>in</strong>g<strong>in</strong>g <strong>the</strong>ir share of total sales down from 34% to 18%.<br />
In contrast, while <strong>the</strong> number of Japanese <strong>and</strong> German players rema<strong>in</strong>ed relatively<br />
constant dur<strong>in</strong>g this period, <strong>the</strong>y <strong>in</strong>creased <strong>the</strong>ir share of <strong>the</strong> total sales of <strong>the</strong> world’s<br />
100 largest suppliers to 29% <strong>and</strong> 25%, respectively, <strong>in</strong> 2015. Lastly, important new<br />
players have emerged, particularly firms from Ch<strong>in</strong>a, India <strong>and</strong> <strong>the</strong> Republic of Korea,<br />
which were virtually absent 15 years ago.<br />
Figure II.7<br />
World’s 100 largest suppliers of components to vehicle manufacturers, by number of firms, sales<br />
<strong>and</strong> enterprise orig<strong>in</strong>, 2000-2015<br />
(Percentages)<br />
Number of firms<br />
Sales<br />
20<br />
16<br />
19<br />
30<br />
18<br />
4<br />
14<br />
4<br />
40<br />
25<br />
2000 2015<br />
9<br />
19<br />
16<br />
14<br />
4<br />
47<br />
29<br />
25<br />
13<br />
6<br />
18<br />
2000 2015<br />
9<br />
}<br />
Important new actors emerge (firms <strong>in</strong><br />
Ch<strong>in</strong>a, India <strong>and</strong> <strong>the</strong> Republic of Korea).<br />
Japanese <strong>and</strong> German firms <strong>in</strong>crease<br />
<strong>the</strong>ir share <strong>in</strong> <strong>the</strong> total sales of <strong>the</strong><br />
world’s 100 largest suppliers, to 29%<br />
}<strong>and</strong> 25%, respectively, <strong>in</strong> 2015.<br />
}<br />
The number of United States firms falls<br />
from 40% <strong>in</strong> 2000 to 25 <strong>in</strong> 2015, <strong>and</strong> <strong>the</strong>ir<br />
share of total sales falls from 47% to 18%.<br />
O<strong>the</strong>r Asian countries<br />
Japan<br />
Germany<br />
O<strong>the</strong>r European countries<br />
O<strong>the</strong>r North <strong>America</strong>n countries<br />
United States<br />
Source: Economic Commission for Lat<strong>in</strong> <strong>America</strong> <strong>and</strong> <strong>the</strong> <strong>Caribbean</strong> (ECLAC), on <strong>the</strong> basis of Automotive News, “Top 100 global OEM parts suppliers. Ranked on 2000 global<br />
OEM automotive parts sales”, Detroit, June 2001 [onl<strong>in</strong>e] https://www.autonews.com/assets/PDF/CA27371020.PDF; “Top 100 global suppliers: <strong>the</strong> top 100 global<br />
OEM parts suppliers ranked by 2005 global OEM parts sales”, Detroit, June 2006 [onl<strong>in</strong>e] https://www.autonews.com/assets/PDF/CA99567518.PDF; “Top 100 global<br />
suppliers: <strong>the</strong> top 100 global OEM parts suppliers ranked by 2010 global OEM parts sales”, Detroit, June 2011 [onl<strong>in</strong>e] https://www.autonews.com/assets/PDF/<br />
CA74326610.PDF; “Top suppliers: North <strong>America</strong>, Europe <strong>and</strong> <strong>the</strong> world”, Detroit, June 2016 [onl<strong>in</strong>e] https://www.autonews.com/assets/PDF/CA105764617.PDF.<br />
Second, despite ma<strong>in</strong>ta<strong>in</strong><strong>in</strong>g a strong presence <strong>in</strong> <strong>the</strong>ir region of orig<strong>in</strong>, parts, accessories<br />
<strong>and</strong> component suppliers rapidly exp<strong>and</strong>ed <strong>the</strong> geographical diversification of <strong>the</strong>ir sales,<br />
accompany<strong>in</strong>g <strong>the</strong> <strong>in</strong>ternationalization process among vehicle manufacturers. Between<br />
2005 <strong>and</strong> 2015, for example, Germany’s Robert Bosch GmbH grew its worldwide sales to<br />
vehicle manufacturers from US$ 28.4 billion to US$ 44.825 billion —reduc<strong>in</strong>g its European<br />
share from 69% to 47%, while practically ma<strong>in</strong>ta<strong>in</strong><strong>in</strong>g its presence <strong>in</strong> North <strong>America</strong> (17%<br />
versus 20%), but exp<strong>and</strong><strong>in</strong>g significantly <strong>in</strong> Asia (from 14% to 31%) (see figure II.8).


