

Foreign Direct Investment in Latin America and the Caribbean 2017
This publication sets out and analyses the main foreign direct investment (FDI) trends in the countries of Latin America and the Caribbean. The 2017 edition shows that the region is at a difficult juncture. FDI inflows declined by 7.9% in 2016, to US$ 167.043 billion, representing a cumulative fall of 17.0% since the peak in 2011. The fall in commodity prices continues to affect investments in natural resources, sluggish economic growth in several countries has slowed the flow of market-seeking capital, and the global backdrop of technological sophistication and expansion of the digital economy has concentrated transnational investments in developed economies.
This publication sets out and analyses the main foreign direct investment (FDI) trends in the countries of Latin America and the Caribbean. The 2017 edition shows that the region is at a difficult juncture. FDI inflows declined by 7.9% in 2016, to US$ 167.043 billion, representing a cumulative fall of 17.0% since the peak in 2011. The fall in commodity prices continues to affect investments in natural resources, sluggish economic growth in several countries has slowed the flow of market-seeking capital, and the global backdrop of technological sophistication and expansion of the digital economy has concentrated transnational investments in developed economies.

You also want an ePaper? Increase the reach of your titles
YUMPU automatically turns print PDFs into web optimized ePapers that Google loves.
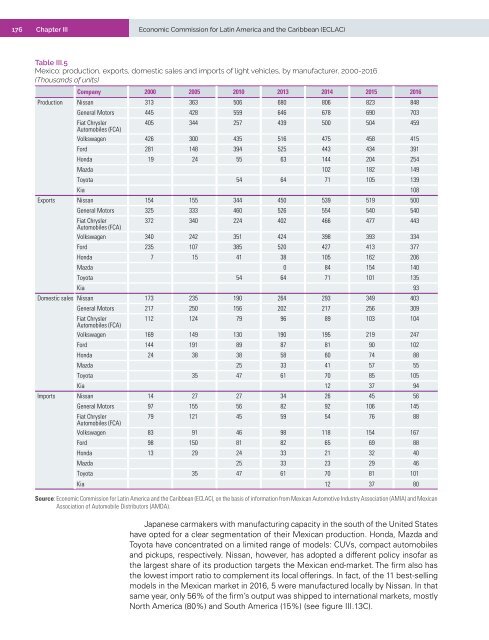
176 Chapter III Economic Commission for Lat<strong>in</strong> <strong>America</strong> <strong>and</strong> <strong>the</strong> <strong>Caribbean</strong> (ECLAC)<br />
Table III.5<br />
Mexico: production, exports, domestic sales <strong>and</strong> imports of light vehicles, by manufacturer, 2000-2016<br />
(Thous<strong>and</strong>s of units)<br />
Company 2000 2005 2010 2013 2014 2015 2016<br />
Production Nissan 313 363 506 680 806 823 848<br />
General Motors 445 428 559 646 678 690 703<br />
Fiat Chrysler<br />
405 344 257 439 500 504 459<br />
Automobiles (FCA)<br />
Volkswagen 426 300 435 516 475 458 415<br />
Ford 281 148 394 525 443 434 391<br />
Honda 19 24 55 63 144 204 254<br />
Mazda 102 182 149<br />
Toyota 54 64 71 105 139<br />
Kia 108<br />
Exports Nissan 154 155 344 450 539 519 500<br />
General Motors 325 333 460 526 554 540 540<br />
Fiat Chrysler<br />
372 340 224 402 466 477 443<br />
Automobiles (FCA)<br />
Volkswagen 340 242 351 424 398 393 334<br />
Ford 235 107 385 520 427 413 377<br />
Honda 7 15 41 38 105 162 206<br />
Mazda 0 84 154 140<br />
Toyota 54 64 71 101 135<br />
Kia 93<br />
Domestic sales Nissan 173 235 190 264 293 349 403<br />
General Motors 217 250 156 202 217 256 309<br />
Fiat Chrysler<br />
112 124 79 96 89 103 104<br />
Automobiles (FCA)<br />
Volkswagen 169 149 130 190 195 219 247<br />
Ford 144 191 89 87 81 90 102<br />
Honda 24 38 38 58 60 74 88<br />
Mazda 25 33 41 57 55<br />
Toyota 35 47 61 70 85 105<br />
Kia 12 37 94<br />
Imports Nissan 14 27 27 34 26 45 56<br />
General Motors 97 155 56 82 92 106 145<br />
Fiat Chrysler<br />
79 121 45 59 54 76 88<br />
Automobiles (FCA)<br />
Volkswagen 83 91 46 98 118 154 167<br />
Ford 98 150 81 82 65 69 88<br />
Honda 13 29 24 33 21 32 40<br />
Mazda 25 33 23 29 46<br />
Toyota 35 47 61 70 81 101<br />
Kia 12 37 80<br />
Source: Economic Commission for Lat<strong>in</strong> <strong>America</strong> <strong>and</strong> <strong>the</strong> <strong>Caribbean</strong> (ECLAC), on <strong>the</strong> basis of <strong>in</strong>formation from Mexican Automotive Industry Association (AMIA) <strong>and</strong> Mexican<br />
Association of Automobile Distributors (AMDA).<br />
Japanese carmakers with manufactur<strong>in</strong>g capacity <strong>in</strong> <strong>the</strong> south of <strong>the</strong> United States<br />
have opted for a clear segmentation of <strong>the</strong>ir Mexican production. Honda, Mazda <strong>and</strong><br />
Toyota have concentrated on a limited range of models: CUVs, compact automobiles<br />
<strong>and</strong> pickups, respectively. Nissan, however, has adopted a different policy <strong>in</strong>sofar as<br />
<strong>the</strong> largest share of its production targets <strong>the</strong> Mexican end-market. The firm also has<br />
<strong>the</strong> lowest import ratio to complement its local offer<strong>in</strong>gs. In fact, of <strong>the</strong> 11 best-sell<strong>in</strong>g<br />
models <strong>in</strong> <strong>the</strong> Mexican market <strong>in</strong> 2016, 5 were manufactured locally by Nissan. In that<br />
same year, only 56% of <strong>the</strong> firm’s output was shipped to <strong>in</strong>ternational markets, mostly<br />
North <strong>America</strong> (80%) <strong>and</strong> South <strong>America</strong> (15%) (see figure III.13C).


