

Foreign Direct Investment in Latin America and the Caribbean 2017
This publication sets out and analyses the main foreign direct investment (FDI) trends in the countries of Latin America and the Caribbean. The 2017 edition shows that the region is at a difficult juncture. FDI inflows declined by 7.9% in 2016, to US$ 167.043 billion, representing a cumulative fall of 17.0% since the peak in 2011. The fall in commodity prices continues to affect investments in natural resources, sluggish economic growth in several countries has slowed the flow of market-seeking capital, and the global backdrop of technological sophistication and expansion of the digital economy has concentrated transnational investments in developed economies.
This publication sets out and analyses the main foreign direct investment (FDI) trends in the countries of Latin America and the Caribbean. The 2017 edition shows that the region is at a difficult juncture. FDI inflows declined by 7.9% in 2016, to US$ 167.043 billion, representing a cumulative fall of 17.0% since the peak in 2011. The fall in commodity prices continues to affect investments in natural resources, sluggish economic growth in several countries has slowed the flow of market-seeking capital, and the global backdrop of technological sophistication and expansion of the digital economy has concentrated transnational investments in developed economies.

You also want an ePaper? Increase the reach of your titles
YUMPU automatically turns print PDFs into web optimized ePapers that Google loves.
<strong>Foreign</strong> <strong>Direct</strong> <strong>Investment</strong> <strong>in</strong> Lat<strong>in</strong> <strong>America</strong> <strong>and</strong> <strong>the</strong> <strong>Caribbean</strong> • <strong>2017</strong><br />
Chapter I<br />
45<br />
The <strong>in</strong>come balance is <strong>the</strong> component with <strong>the</strong> largest deficit <strong>and</strong> <strong>the</strong> one that<br />
produces <strong>the</strong> greatest net outflows of funds abroad. With<strong>in</strong> this item, <strong>the</strong> biggest<br />
component is <strong>the</strong> repatriation of FDI profits by transnational firms to <strong>the</strong>ir parent<br />
companies <strong>and</strong>, despite <strong>the</strong> drop <strong>in</strong> FDI <strong>in</strong>come <strong>in</strong> 2016, <strong>the</strong> <strong>in</strong>come balance deficit is<br />
still equivalent to -2.5% of GDP.<br />
When FDI <strong>in</strong>flows <strong>and</strong> <strong>in</strong>come outflows derived from FDI stock <strong>in</strong> each country are<br />
comb<strong>in</strong>ed, <strong>the</strong>ir impact on <strong>the</strong> balance of payments becomes clear. While <strong>the</strong> impact<br />
of FDI is generally positive, <strong>the</strong> picture is more complex when consider<strong>in</strong>g <strong>the</strong> different<br />
countries of <strong>the</strong> region.<br />
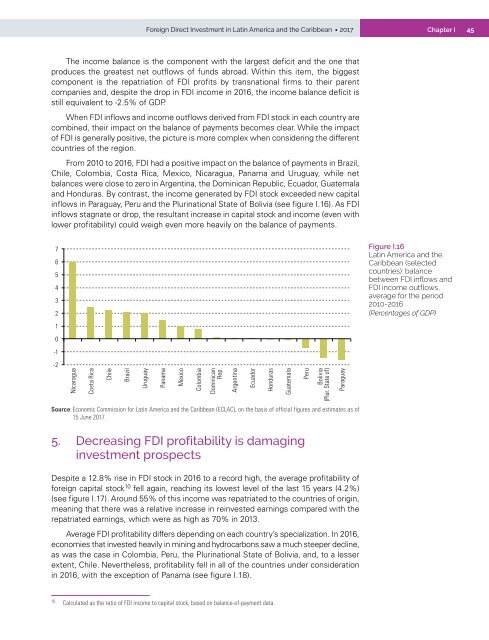
From 2010 to 2016, FDI had a positive impact on <strong>the</strong> balance of payments <strong>in</strong> Brazil,<br />
Chile, Colombia, Costa Rica, Mexico, Nicaragua, Panama <strong>and</strong> Uruguay, while net<br />
balances were close to zero <strong>in</strong> Argent<strong>in</strong>a, <strong>the</strong> Dom<strong>in</strong>ican Republic, Ecuador, Guatemala<br />
<strong>and</strong> Honduras. By contrast, <strong>the</strong> <strong>in</strong>come generated by FDI stock exceeded new capital<br />
<strong>in</strong>flows <strong>in</strong> Paraguay, Peru <strong>and</strong> <strong>the</strong> Plur<strong>in</strong>ational State of Bolivia (see figure I.16). As FDI<br />
<strong>in</strong>flows stagnate or drop, <strong>the</strong> resultant <strong>in</strong>crease <strong>in</strong> capital stock <strong>and</strong> <strong>in</strong>come (even with<br />
lower profitability) could weigh even more heavily on <strong>the</strong> balance of payments.<br />
7<br />
6<br />
5<br />
4<br />
3<br />
2<br />
Figure I.16<br />
Lat<strong>in</strong> <strong>America</strong> <strong>and</strong> <strong>the</strong><br />
<strong>Caribbean</strong> (selected<br />
countries): balance<br />
between FDI <strong>in</strong>flows <strong>and</strong><br />
FDI <strong>in</strong>come outflows,<br />
average for <strong>the</strong> period<br />
2010-2016<br />
(Percentages of GDP)<br />
1<br />
0<br />
-1<br />
-2<br />
Nicaragua<br />
Costa Rica<br />
Chile<br />
Brazil<br />
Uruguay<br />
Panama<br />
Mexico<br />
Colombia<br />
Dom<strong>in</strong>ican<br />
Rep.<br />
Argent<strong>in</strong>a<br />
Ecuador<br />
Honduras<br />
Guatemala<br />
Peru<br />
Bolivia<br />
(Plur. State of)<br />
Paraguay<br />
Source: Economic Commission for Lat<strong>in</strong> <strong>America</strong> <strong>and</strong> <strong>the</strong> <strong>Caribbean</strong> (ECLAC), on <strong>the</strong> basis of official figures <strong>and</strong> estimates as of<br />
15 June <strong>2017</strong>.<br />
5. Decreas<strong>in</strong>g FDI profitability is damag<strong>in</strong>g<br />
<strong>in</strong>vestment prospects<br />
Despite a 12.8% rise <strong>in</strong> FDI stock <strong>in</strong> 2016 to a record high, <strong>the</strong> average profitability of<br />
foreign capital stock 10 fell aga<strong>in</strong>, reach<strong>in</strong>g its lowest level of <strong>the</strong> last 15 years (4.2%)<br />
(see figure I.17). Around 55% of this <strong>in</strong>come was repatriated to <strong>the</strong> countries of orig<strong>in</strong>,<br />
mean<strong>in</strong>g that <strong>the</strong>re was a relative <strong>in</strong>crease <strong>in</strong> re<strong>in</strong>vested earn<strong>in</strong>gs compared with <strong>the</strong><br />
repatriated earn<strong>in</strong>gs, which were as high as 70% <strong>in</strong> 2013.<br />
Average FDI profitability differs depend<strong>in</strong>g on each country’s specialization. In 2016,<br />
economies that <strong>in</strong>vested heavily <strong>in</strong> m<strong>in</strong><strong>in</strong>g <strong>and</strong> hydrocarbons saw a much steeper decl<strong>in</strong>e,<br />
as was <strong>the</strong> case <strong>in</strong> Colombia, Peru, <strong>the</strong> Plur<strong>in</strong>ational State of Bolivia, <strong>and</strong>, to a lesser<br />
extent, Chile. Never<strong>the</strong>less, profitability fell <strong>in</strong> all of <strong>the</strong> countries under consideration<br />
<strong>in</strong> 2016, with <strong>the</strong> exception of Panama (see figure I.18).<br />
10<br />
Calculated as <strong>the</strong> ratio of FDI <strong>in</strong>come to capital stock, based on balance-of-payment data.


