

Foreign Direct Investment in Latin America and the Caribbean 2017
This publication sets out and analyses the main foreign direct investment (FDI) trends in the countries of Latin America and the Caribbean. The 2017 edition shows that the region is at a difficult juncture. FDI inflows declined by 7.9% in 2016, to US$ 167.043 billion, representing a cumulative fall of 17.0% since the peak in 2011. The fall in commodity prices continues to affect investments in natural resources, sluggish economic growth in several countries has slowed the flow of market-seeking capital, and the global backdrop of technological sophistication and expansion of the digital economy has concentrated transnational investments in developed economies.
This publication sets out and analyses the main foreign direct investment (FDI) trends in the countries of Latin America and the Caribbean. The 2017 edition shows that the region is at a difficult juncture. FDI inflows declined by 7.9% in 2016, to US$ 167.043 billion, representing a cumulative fall of 17.0% since the peak in 2011. The fall in commodity prices continues to affect investments in natural resources, sluggish economic growth in several countries has slowed the flow of market-seeking capital, and the global backdrop of technological sophistication and expansion of the digital economy has concentrated transnational investments in developed economies.

Create successful ePaper yourself
Turn your PDF publications into a flip-book with our unique Google optimized e-Paper software.
<strong>Foreign</strong> <strong>Direct</strong> <strong>Investment</strong> <strong>in</strong> Lat<strong>in</strong> <strong>America</strong> <strong>and</strong> <strong>the</strong> <strong>Caribbean</strong> • <strong>2017</strong><br />
Chapter I<br />
47<br />
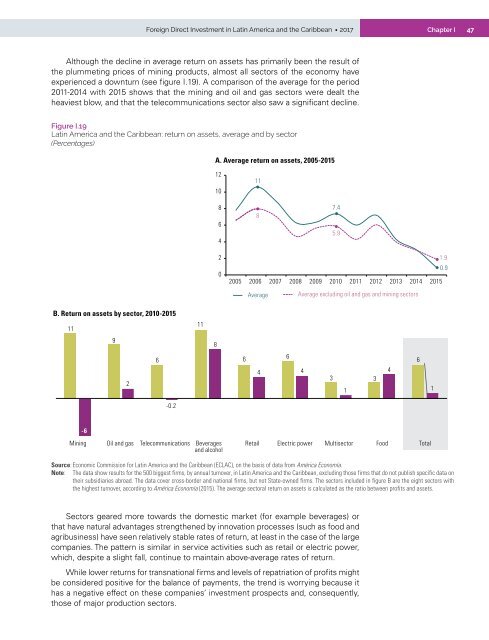
Although <strong>the</strong> decl<strong>in</strong>e <strong>in</strong> average return on assets has primarily been <strong>the</strong> result of<br />
<strong>the</strong> plummet<strong>in</strong>g prices of m<strong>in</strong><strong>in</strong>g products, almost all sectors of <strong>the</strong> economy have<br />
experienced a downturn (see figure I.19). A comparison of <strong>the</strong> average for <strong>the</strong> period<br />
2011-2014 with 2015 shows that <strong>the</strong> m<strong>in</strong><strong>in</strong>g <strong>and</strong> oil <strong>and</strong> gas sectors were dealt <strong>the</strong><br />
heaviest blow, <strong>and</strong> that <strong>the</strong> telecommunications sector also saw a significant decl<strong>in</strong>e.<br />
Figure I.19<br />
Lat<strong>in</strong> <strong>America</strong> <strong>and</strong> <strong>the</strong> <strong>Caribbean</strong>: return on assets, average <strong>and</strong> by sector<br />
(Percentages)<br />
A. Average return on assets, 2005-2015<br />
12<br />
10<br />
8<br />
6<br />
4<br />
11<br />
8<br />
7.4<br />
5.9<br />
2<br />
0<br />
1.9<br />
0.9<br />
2005 2006 2007 2008 2009 2010 2011 2012 2013 2014 2015<br />
Average<br />
Average exclud<strong>in</strong>g oil <strong>and</strong> gas <strong>and</strong> m<strong>in</strong><strong>in</strong>g sectors<br />
B. Return on assets by sector, 2010-2015<br />
11<br />
11<br />
9<br />
8<br />
2<br />
6<br />
6<br />
6<br />
4 4<br />
3 3<br />
1<br />
4<br />
6<br />
1<br />
-0.2<br />
-6<br />
M<strong>in</strong><strong>in</strong>g Oil <strong>and</strong> gas Telecommunications Beverages<br />
<strong>and</strong> alcohol<br />
Retail Electric power Multisector<br />
Source: 2010-2014 Economic Commission for Lat<strong>in</strong> <strong>America</strong> 2015 <strong>and</strong> <strong>the</strong> <strong>Caribbean</strong> (ECLAC), on <strong>the</strong> basis of data from América Economía.<br />
Note: The data show results for <strong>the</strong> 500 biggest firms, by annual turnover, <strong>in</strong> Lat<strong>in</strong> <strong>America</strong> <strong>and</strong> <strong>the</strong> <strong>Caribbean</strong>, exclud<strong>in</strong>g those firms that do not publish specific data on<br />
<strong>the</strong>ir subsidiaries abroad. The data cover cross-border <strong>and</strong> national firms, but not State-owned firms. The sectors <strong>in</strong>cluded <strong>in</strong> figure B are <strong>the</strong> eight sectors with<br />
<strong>the</strong> highest turnover, accord<strong>in</strong>g to América Economía (2015). The average sectoral return on assets is calculated as <strong>the</strong> ratio between profits <strong>and</strong> assets.<br />
Food<br />
Total<br />
Sectors geared more towards <strong>the</strong> domestic market (for example beverages) or<br />
that have natural advantages streng<strong>the</strong>ned by <strong>in</strong>novation processes (such as food <strong>and</strong><br />
agribus<strong>in</strong>ess) have seen relatively stable rates of return, at least <strong>in</strong> <strong>the</strong> case of <strong>the</strong> large<br />
companies. The pattern is similar <strong>in</strong> service activities such as retail or electric power,<br />
which, despite a slight fall, cont<strong>in</strong>ue to ma<strong>in</strong>ta<strong>in</strong> above-average rates of return.<br />
While lower returns for transnational firms <strong>and</strong> levels of repatriation of profits might<br />
be considered positive for <strong>the</strong> balance of payments, <strong>the</strong> trend is worry<strong>in</strong>g because it<br />
has a negative effect on <strong>the</strong>se companies’ <strong>in</strong>vestment prospects <strong>and</strong>, consequently,<br />
those of major production sectors.


