

Foreign Direct Investment in Latin America and the Caribbean 2017
This publication sets out and analyses the main foreign direct investment (FDI) trends in the countries of Latin America and the Caribbean. The 2017 edition shows that the region is at a difficult juncture. FDI inflows declined by 7.9% in 2016, to US$ 167.043 billion, representing a cumulative fall of 17.0% since the peak in 2011. The fall in commodity prices continues to affect investments in natural resources, sluggish economic growth in several countries has slowed the flow of market-seeking capital, and the global backdrop of technological sophistication and expansion of the digital economy has concentrated transnational investments in developed economies.
This publication sets out and analyses the main foreign direct investment (FDI) trends in the countries of Latin America and the Caribbean. The 2017 edition shows that the region is at a difficult juncture. FDI inflows declined by 7.9% in 2016, to US$ 167.043 billion, representing a cumulative fall of 17.0% since the peak in 2011. The fall in commodity prices continues to affect investments in natural resources, sluggish economic growth in several countries has slowed the flow of market-seeking capital, and the global backdrop of technological sophistication and expansion of the digital economy has concentrated transnational investments in developed economies.

You also want an ePaper? Increase the reach of your titles
YUMPU automatically turns print PDFs into web optimized ePapers that Google loves.
46 Chapter I Economic Commission for Lat<strong>in</strong> <strong>America</strong> <strong>and</strong> <strong>the</strong> <strong>Caribbean</strong> (ECLAC)<br />
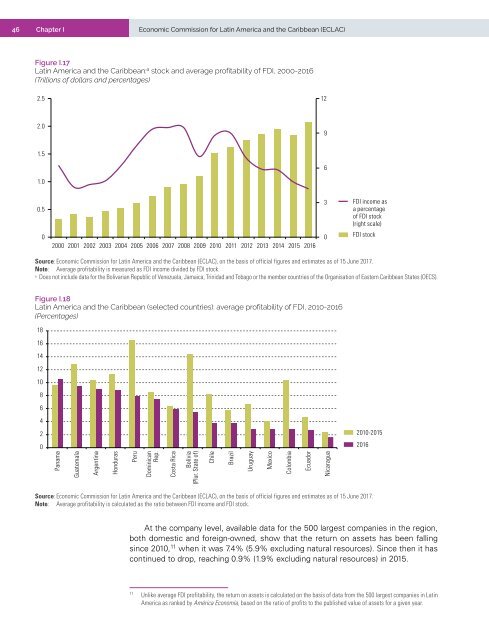
Figure I.17<br />
Lat<strong>in</strong> <strong>America</strong> <strong>and</strong> <strong>the</strong> <strong>Caribbean</strong>: a stock <strong>and</strong> average profitability of FDI, 2000-2016<br />
(Trillions of dollars <strong>and</strong> percentages)<br />
2.5<br />
12<br />
2.0<br />
9<br />
1.5<br />
6<br />
1.0<br />
0.5<br />
0<br />
2000 2001 2002 2003 2004 2005 2006 2007 2008 2009 2010 2011 2012 2013 2014 2015 2016<br />
3<br />
0<br />
FDI <strong>in</strong>come as<br />
a percentage<br />
of FDI stock<br />
(right scale)<br />
FDI stock<br />
Source: Economic Commission for Lat<strong>in</strong> <strong>America</strong> <strong>and</strong> <strong>the</strong> <strong>Caribbean</strong> (ECLAC), on <strong>the</strong> basis of official figures <strong>and</strong> estimates as of 15 June <strong>2017</strong>.<br />
Note: Average profitability is measured as FDI <strong>in</strong>come divided by FDI stock.<br />
a<br />
Does not <strong>in</strong>clude data for <strong>the</strong> Bolivarian Republic of Venezuela, Jamaica, Tr<strong>in</strong>idad <strong>and</strong> Tobago or <strong>the</strong> member countries of <strong>the</strong> Organisation of Eastern <strong>Caribbean</strong> States (OECS).<br />
Figure I.18<br />
Lat<strong>in</strong> <strong>America</strong> <strong>and</strong> <strong>the</strong> <strong>Caribbean</strong> (selected countries): average profitability of FDI, 2010-2016<br />
(Percentages)<br />
18<br />
16<br />
14<br />
12<br />
10<br />
8<br />
6<br />
4<br />
2<br />
2010-2015<br />
0<br />
2016<br />
Panama<br />
Guatemala<br />
Argent<strong>in</strong>a<br />
Honduras<br />
Peru<br />
Dom<strong>in</strong>ican<br />
Rep.<br />
Costa Rica<br />
Bolivia<br />
(Plur. State of)<br />
Chile<br />
Brazil<br />
Uruguay<br />
Mexico<br />
Colombia<br />
Ecuador<br />
Nicaragua<br />
Source: Economic Commission for Lat<strong>in</strong> <strong>America</strong> <strong>and</strong> <strong>the</strong> <strong>Caribbean</strong> (ECLAC), on <strong>the</strong> basis of official figures <strong>and</strong> estimates as of 15 June <strong>2017</strong>.<br />
Note: Average profitability is calculated as <strong>the</strong> ratio between FDI <strong>in</strong>come <strong>and</strong> FDI stock.<br />
At <strong>the</strong> company level, available data for <strong>the</strong> 500 largest companies <strong>in</strong> <strong>the</strong> region,<br />
both domestic <strong>and</strong> foreign-owned, show that <strong>the</strong> return on assets has been fall<strong>in</strong>g<br />
s<strong>in</strong>ce 2010, 11 when it was 7.4% (5.9% exclud<strong>in</strong>g natural resources). S<strong>in</strong>ce <strong>the</strong>n it has<br />
cont<strong>in</strong>ued to drop, reach<strong>in</strong>g 0.9% (1.9% exclud<strong>in</strong>g natural resources) <strong>in</strong> 2015.<br />
11<br />
Unlike average FDI profitability, <strong>the</strong> return on assets is calculated on <strong>the</strong> basis of data from <strong>the</strong> 500 largest companies <strong>in</strong> Lat<strong>in</strong><br />
<strong>America</strong> as ranked by América Economía, based on <strong>the</strong> ratio of profits to <strong>the</strong> published value of assets for a given year.


